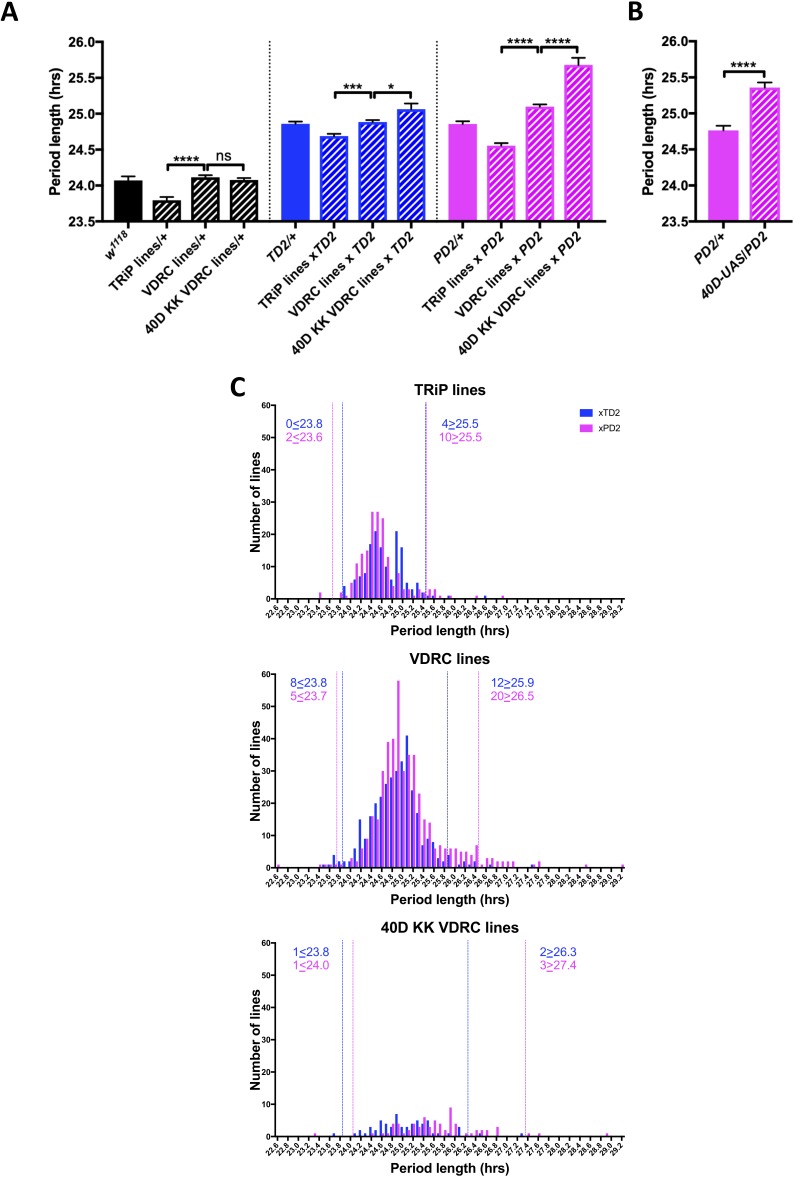
Figure 1. An RNAi screen of RNA associated proteins identifies long and short period hits.
(A–B) Background effect of TRiP and VDRC collections on circadian period length. Circadian period length (hrs) is plotted on the y axis. RNAi collection and genotypes are labeled. Error bars represent SEM. (A) Left group (black bars): Patterned bars are the average of period lengths of a subset of RNAi lines in the screen crossed to w1118 (TRiP/+ N = 17 crosses, VDRC/+ N = 46 crosses, 40D KK VDRC/+ N = 20 crosses). Solid bar is the w1118 control (N = 20 crosses). Middle group (blue bars): Patterned bars are the average of period lengths of all RNAi lines in the screen crossed to tim-GAL4, UAS-Dicer2 (TD2) (TRiP/TD2 N = 151 crosses, VDRC/TD2 N = 340 crosses, 40D KK VDRC/TD2 N = 61 crosses). Solid bar is the TD2/+ control (N = 35 crosses). Right group (magenta bars): Patterned bars are the average of period lengths of all RNAi lines in the screen crossed to Pdf-GAL4, UAS-Dicer2 (PD2) (TRiP/PD2 N = 176 crosses, VDRC/PD2 N = 448 crosses, 40D KK VDRC/PD2 N = 69 crosses). Solid bar is the PD2/+ control (N = 36 crosses). One-way ANOVA followed by Tukey’s multiple comparison test: *p<0.05, ***p<0.001, ****p<0.0001. Note that the overall period lengthening, relative to wild-type (w1118), when RNAi lines are crossed to TD2 or PD2 is a background effect of our drivers (see main text), while the period differences between the TRiP (shorter) and VDRC (longer) collections is most likely a background effect of the RNAi lines themselves. There is also a lengthening effect of the 40D insertion site in the VDRC KK collection that cannot be explained by a background effect, as it is not present in the RNAi controls (Left panel). Instead the lengthening was only observed when these lines were crossed to our drivers. A modest effect was seen with TD2 (middle panel) and a larger effect was seen with PD2 (right panel). (B) The period lengthening effect of the VDRC 40D KK lines is likely due to overexpression of tio, as we observed lengthening when a control line that lacks a RNAi transgene, but still has a UAS insertion in the 40D (40D-UAS) locus was crossed to PD2. N = 32 flies per genotype, ****p<0.0001, Unpaired Student’s t-test. (C) Histogram of period lengths obtained in the initial round of screening. Number of lines per bin is on the y axis. Binned period length (hrs) is on the x axis. Bin size is 0.1 hr. TD2 crosses are in blue and PD2 crosses are in magenta. Dashed lines indicate our cutoff of 2 standard deviations from the mean. Number of crosses that fell above or below the cutoff is indicated. Top panel: TRiP lines. 0 lines crossed to TD2 and 2 lines crossed to PD2 gave rise to short periods and were selected for repeats. four lines crossed to TD2 and 10 lines crossed to PD2 gave rise to long periods and were selected for repeats. Middle panel: VDRC lines. eight lines crossed to TD2 and 5 lines crossed to PD2 gave rise to short periods and were selected for repeats. 12 lines crossed to TD2 and 20 lines crossed to PD2 gave rise to long periods and were selected for repeats. Bottom panel: VDRC 40D KK lines. one line crossed to TD2 and 1 line crossed to PD2 gave rise to short periods and were selected for repeats. two lines crossed to TD2 and 3 lines crossed to PD2 gave rise to long periods and were selected for repeats.

