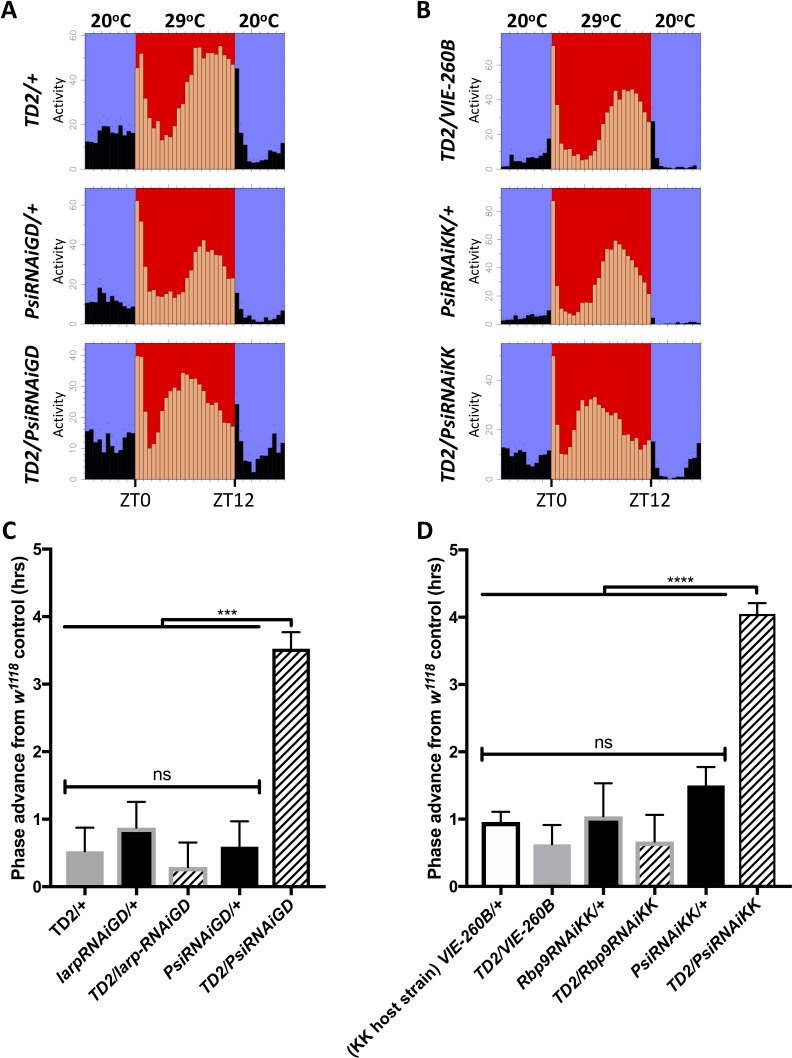
Figure 4. Knockdown of Psi advances the phase of circadian behavior under temperature cycle.
(A) Eductions showing the average activity of flies during 4 days of 12:12 29°C(red)/20°C(blue) temperature entrainment (days 7–10) in DD. Top panels: (driver controls) TD2/+ (left), TD2/VIE-260B (right). Middle panels: (RNAi controls) PsiRNAiGD/+ (left), PsiRNAiKK/+ (right). Bottom panels: (Psi knockdown) TD2/PsiRNAiGD (left), TD2/PsiRNAiKK (right). Note that, Psi knockdown flies advance the phase of their evening activity by about 2.5 hr relative to controls. (C–D) Evening peak phase relative to an internal control in each run (w1118) (hrs) is plotted on the y axis. Genotypes are listed on the x axis. Error bars represent SEM. ***p<0.001, ****p<0.0001, one-way ANOVA followed by Tukey’s multiple comparison test. N = 3–5 runs (C) Quantification of PsiRNAiGD knockdown and controls. Note additional RNAi controls: larpRNAiGD/+ (black bar, gray border) and TD2/larpRNAiGD (patterned bar, gray border). larpRNAiGD (GD8214) is an RNAi line from the GD collection that targets a RAP from our screen that was not a hit. (D) Quantification of PsiRNAiKK knockdown and controls. Note additional RNAi controls: VIE260B/+ (white bar, black border), TD2/VIE260B (gray bar), Rbp9RNAiKK/+ (black bar, gray border) and TD2/Rbp9RNAiKK (patterned bar, gray border). VIE260B is a KK collection host strain control containing the 30B transgene insertion site. Rbp9RNAiKK (KK109093) is an RNAi line from the KK collection targeting a RAP from our screen that was not a hit.


