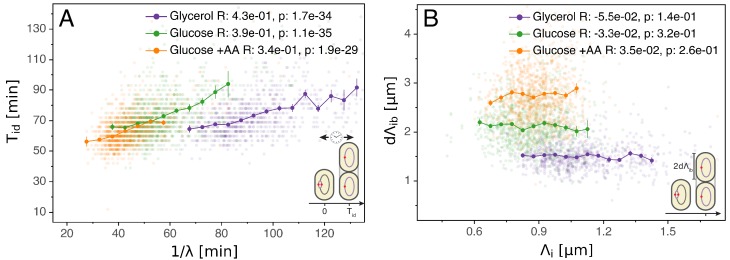
Figure 3. Initiation to division period.
(A) Several models assume that a constant time passes from an initiation event to it corresponding division event. However, within each growth condition, that period is clearly dependent on fluctuations in growth rate. (B) The length accumulated from initiation to division is constant for each growth condition, suggesting an adder behavior for that period. In A and B, the Pearson correlation coefficient R and p values are indicated for each condition.

