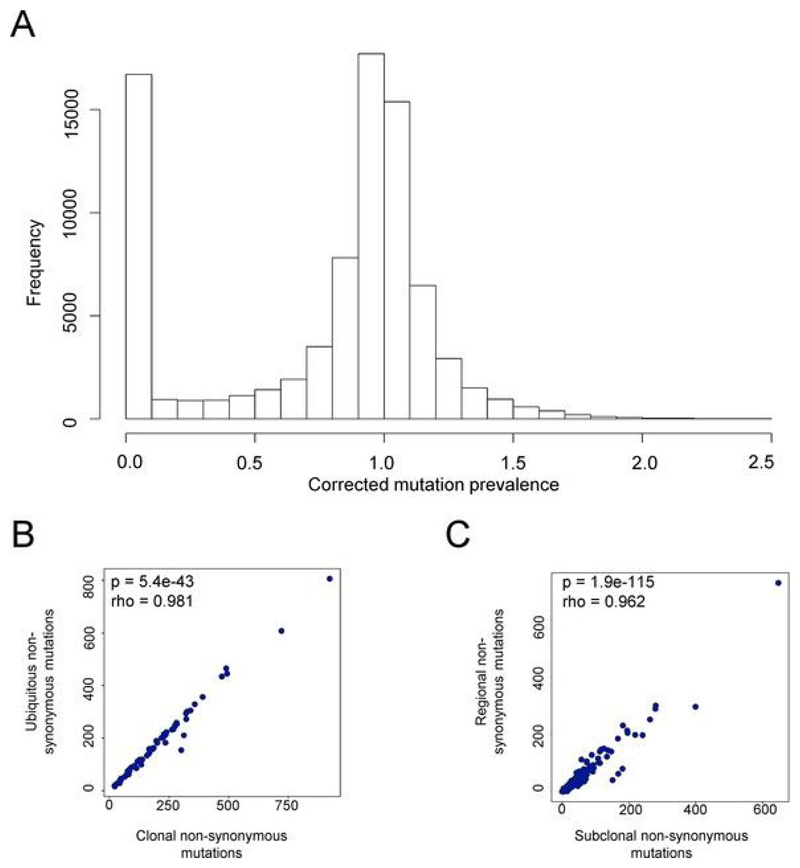
Extended Data Fig. 5. Mutation prevalence defines ubiquitous and regional mutations in NSCLC.
a, The frequency histogram of corrected mutation prevalence for all mutations in the TRACERx patient cohort analyzed in this paper. Mutation prevalence (number of mutant reads/number of wild-type reads) was corrected for tumor purity and local genomic copy number as described in the Methods. The distribution is bimodal, with peaks at zero (0–10%, very few mutant reads) and 1 (corresponding to every cell in a tumor region carrying the mutation on one chromosome). b, The number of ubiquitous mutations defined as described in the Methods is plotted against the number of clonal mutations, calculated as described in Jamal-Hanjani et al.[39] for all patients analyzed in this study. c, The number of regional mutations defined as described in the Methods is plotted against the number of subclonal mutations, calculated as described in Jamal-Hanjani et al.[39].

