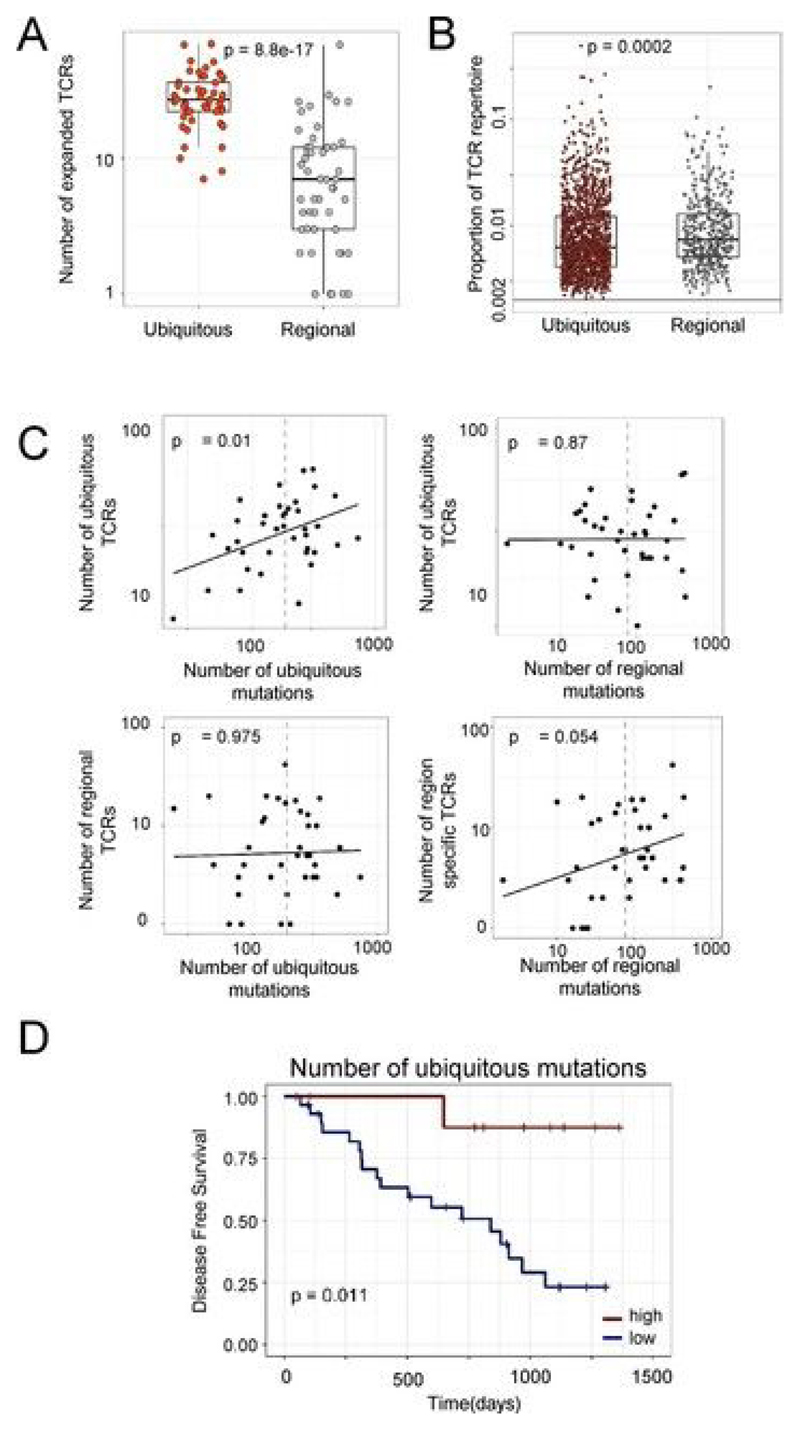
Extended Data Fig. 6. The number of ubiquitous and regional TCRs correlates with the number of ubiquitous and regional nonsynonymous mutations, respectively.
a, The numbers of expanded (frequency ≥ 2/l,000) ubiquitous (red circles) and regional TCR (β-chain) sequences (gray circles) is shown for each tumor region. The number of ubiquitous mutations is greater than the number of regional mutations, with the Mann–Whitney P value shown; n = 52. b, The frequency distribution of the intratumoral expanded β-chain ubiquitous (red circles) and regional (gray circles) TCRs is shown. The two distributions were not significantly different when compared by the Kolmogorov–Smirnov test, P = 0.78. c, The number of expanded ubiquitous (top) or regional (bottom) β-chain sequences is plotted against the number of ubiquitous or regional nonsynonymous mutations for each tumor region. The Spearman's rank correlation coefficient and associated P value are shown; the dashed lines indicate median values. n = 42. d, Patients were stratified according to the number of ubiquitous mutations. The red line indicates a ratio above the top quartile and the blue line indicates a ratio below the top quartile. The Kaplan–Meier statistical P value is shown.

