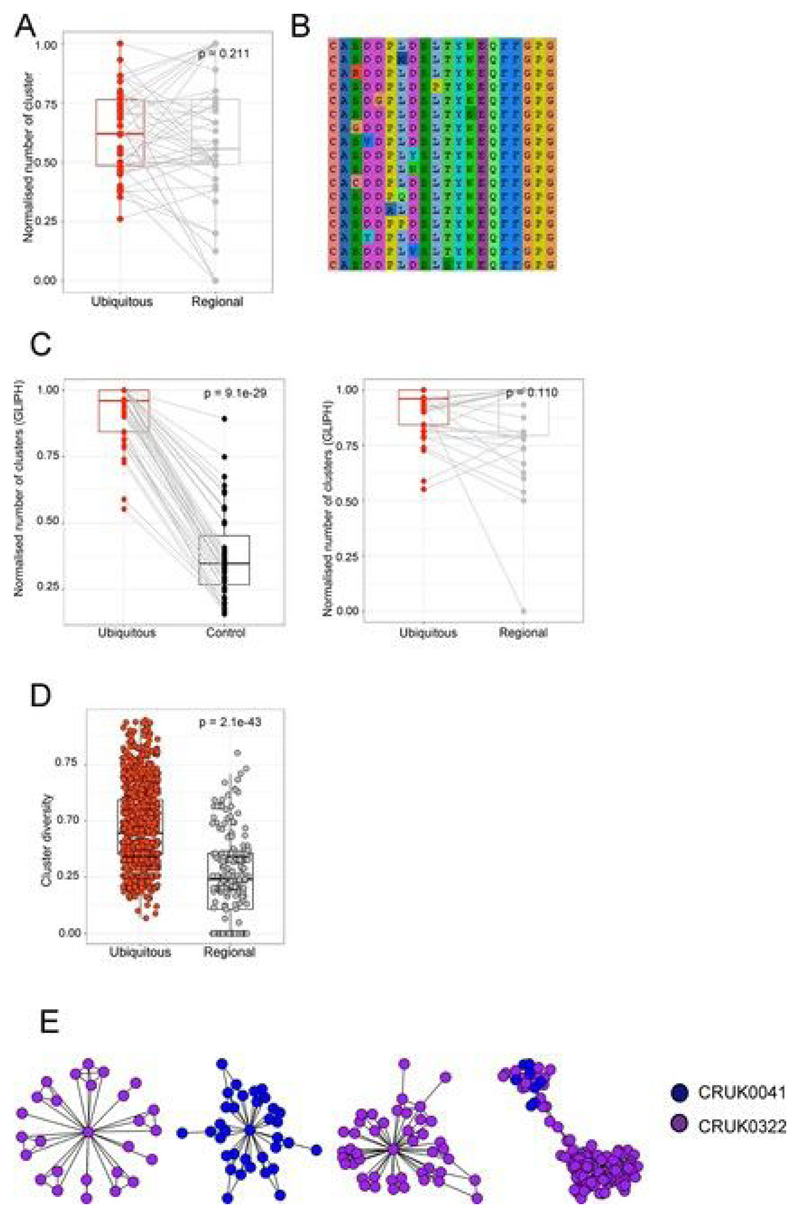
Extended Data Fig. 8. Network diagram of clusters of intratumoral CDR3 β-chain sequences shown for all patient CDR3 repertoires.
All panels show the network of TCR CDR3 β-chain sequences that are connected to at least one other expanded intratumoral ubiquitous TCR (shown as red circles). Clusters are defined as networks with at least two nodes. Only those patients with at least one cluster are shown.

