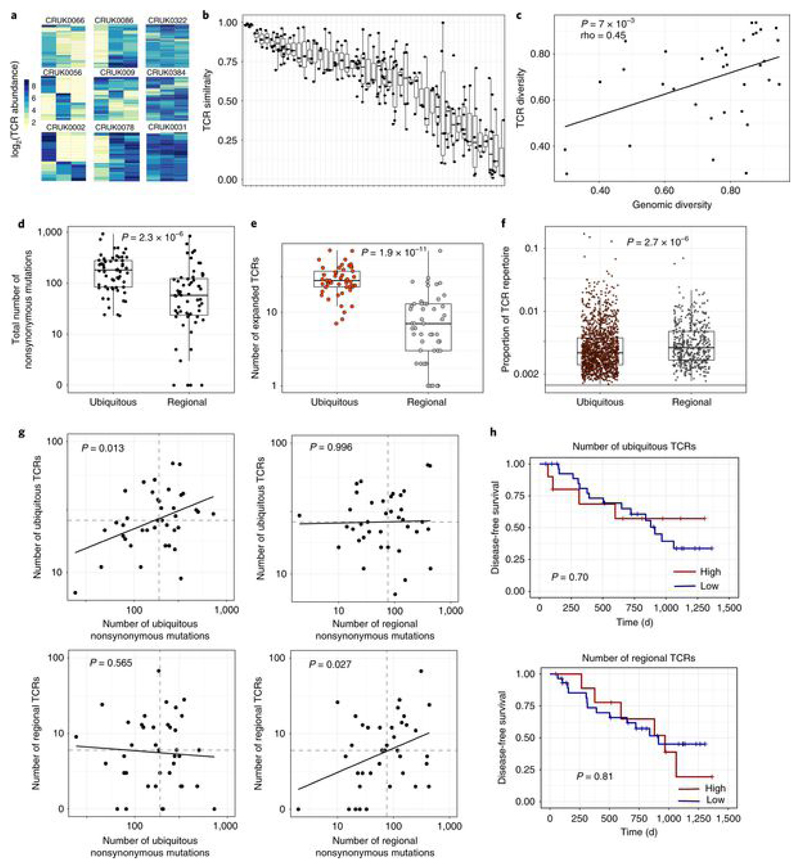
Fig. 2. NSCLC tumors contain expanded ubiquitous and regional TCRs, which reflect the tumor mutational landscape.
a, Heat maps showing the abundance (log2 of the number of times each TCR was found) of expanded intratumoral α-chain sequences (frequency ≥ 2/1,000) in different tumor regions for several patients. Patient ID is shown above each heat map. Each row represents one unique sequence, and each column represents one tumor region. Equivalent plots for β-chain sequences are shown in Extended Data Fig. 4a. b, The TCR repertoires of multiple regions from a patient’s tumor were sequenced and a pairwise comparison of the repertoires of different regions from the same tumor was performed by using the cosine similarity (see Methods). The pairwise intratumoral TCR repertoire similarity (α-chain sequences; the equivalent plot for β-chain sequences is in Extended Data Fig. 4b) is shown for each patient. Each circle represents a comparison between two regions from the same patient’s tumor (n = 226 total comparisons from 49 patients). For all box plots, the minimum and maximum are indicated by the extreme points of the box plot; the median is indicated by the thick horizontal line; and the first and third quartiles are indicated by box edges. Patients are ordered along the x axis by descending mean intratumoral TCR similarity. c, TCR repertoire (α-chain sequences) diversity plotted against genomic diversity for each patient. The diversity measurement was calculated as the normalized Shannon entropy (see Methods). The Spearman’s rank correlation coefficient and P value are shown; n = 38 patients. The equivalent plot for β-chain sequences is shown in Extended Data Fig. 4c. d, The numbers of ubiquitous and regional nonsynonymous mutations for each tumor region. The minimum and maximum are indicated by the extreme points of the box plot; the median is indicated by the thick horizontal line; and the first and third quartiles are indicated by box edges. The number of ubiquitous mutations is greater than the number of regional mutations, with the two-sided Mann–Whitney test P value shown; n = 60 patients. e, The numbers of expanded (frequency ≥ 2/1,000) ubiquitous (red circles) and regional (gray circles) α-chain sequences for each tumor region. The minimum and maximum are indicated by the extreme points of the box plot; the median is indicated by the thick horizontal line; and the first and third quartiles are indicated by box edges. The number of ubiquitous TCRs is greater than the number of regional TCRs, with the two-sided Mann–Whitney test P value shown; n = 49 patients. The equivalent plot for β-chain sequences is shown in Extended Data Fig. 6a. f, The frequency distribution of the intratumoral expanded α-chain ubiquitous (red circles; n = 1,379 individual TCRs combined from 49 patients) and regional (gray circles; n = 446 individual TCRs from 44 patients) TCRs. The minimum and maximum are indicated by the extreme points of the box plot; the median is indicated by the thick horizontal line; and the first and third quartiles are indicated by box edges. Expanded regional TCRs are expressed at a higher abundance than ubiquitous TCRs when compared by two-sided Mann–Whitney test (P = 2.7 × 10⁻⁶). The equivalent plot for β-chain sequences is shown in Extended Data Fig. 6b. g, The number of expanded ubiquitous (top) or regional (bottom) α-chain sequences plotted against the number of ubiquitous (left) or regional (right) nonsynonymous mutations for each tumor region. The Spearman’s rank correlation and associated P value are shown; dashed lines correspond to median values. n = 39 patients. The equivalent plot for β-chain sequences is shown in Extended Data Fig. 6c. h, Patients were stratified according to the number of expanded intratumoral ubiquitous α-chain sequences (top) or the number of expanded intratumoral regional α-chain sequences (bottom). n = 39 patients. The red line indicates a ratio above the median, and the blue line indicates a ratio below the median. Kaplan–Meier P values are shown.

