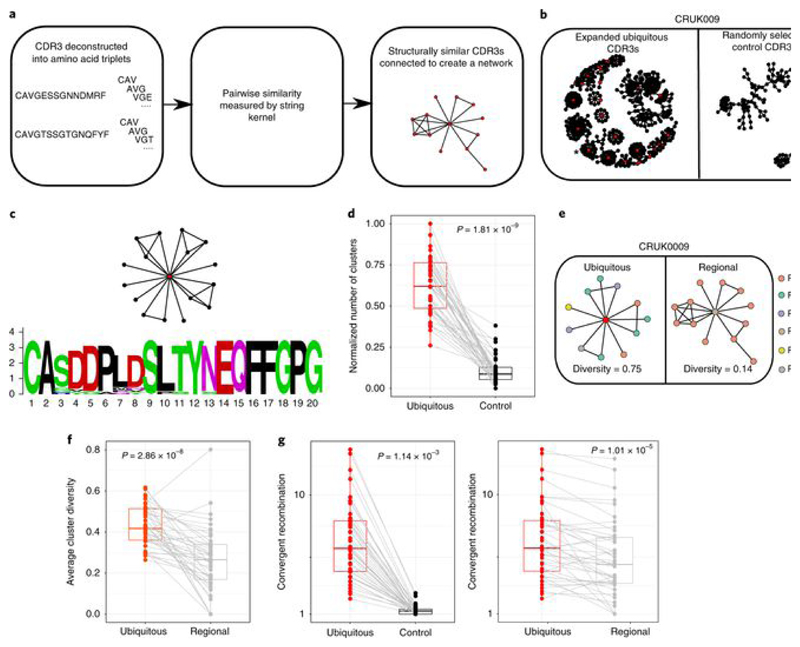
Fig. 3. Expanded intratumoral TCR CDR3 sequences identify clusters of related TCRs and show enhanced convergent recombination.
a, Diagram illustrating the CDR3 similarity network construction process. Individual CDR3s are deconstructed into overlapping series of contiguous amino acid triplets, and the pairwise similarity between two CDR3s is calculated as the normalized string (triplet) kernel. CDR3s that have a pairwise similarity of >0.82 are connected by an edge. b, Representative network diagrams of intratumoral CDR3 β-chain sequences for patient CRUK0009. Both panels show the network of TCR CDR3 β-chain sequences that are connected to at least one other TCR within the tumor. Left, clustering around expanded intratumoral ubiquitous TCRs (red circles). An asterisk indicates a cluster whose CDR3 sequences are analyzed in c. Right, clustering around a random sample of TCRs from the same repertoire (same numbers as for the expanded ubiquitous TCRs). c, A representative example of alignment of CDR3 sequences from a single cluster (full alignment in Extended Data Fig. 8b). The alignment ts shown as a sequence logo (https://weblogo.berkeley.edu/logo.cgi). d, The clustering algorithm was run on all patients, and the number of clusters for the networks containing expanded ubiquitous and control randomly selected β-chain sequences is shown. The minimum and maximum are indicated by the extreme points of the box plot; the median is indicated by the thick horizontal line; and the first and third quartiles are indicated by box edges. The expanded TCRs exhibit greater clustering, with the one-sided Mann–Whitney test P value shown; n = 46 patients. e, Representative clustering around a ubiquitous or regional expanded TCR from CRUK0009, with nodes colored according to the regions in which each TCR was found. f, The average cluster Shannon diversity (see Methods) for clusters containing ubiquitous or regional expanded TCRs. The one-sided Mann–Whitney test P value is shown; n = 42 patients. The minimum and maximum are indicated by the extreme points of the box plot; the median is indicated by the thick horizontal line; and the first and third quartiles are indicated by box edges. g, The amount of convergent recombination was calculated as the average number of distinct DNA TCR sequences that contributed to each observed TCR CDR3 amino acid sequence for each expanded ubiquitous TCR, as compared to a randomly selected set of TCRs (left) or regional TCRs (right) from each patient intratumoral repertoire. One-sided Mann–Whitney P values are shown; n = 43 patients.The minimum and maximum are indicated by the extreme points of the box plot; the median is indicated by the thick horizontal line; and the first and third quartiles are indicated by box edges. All panels in this figure refer to TCR β-chain sequences, as these showed more diversity and a lower background rate of clustering.

