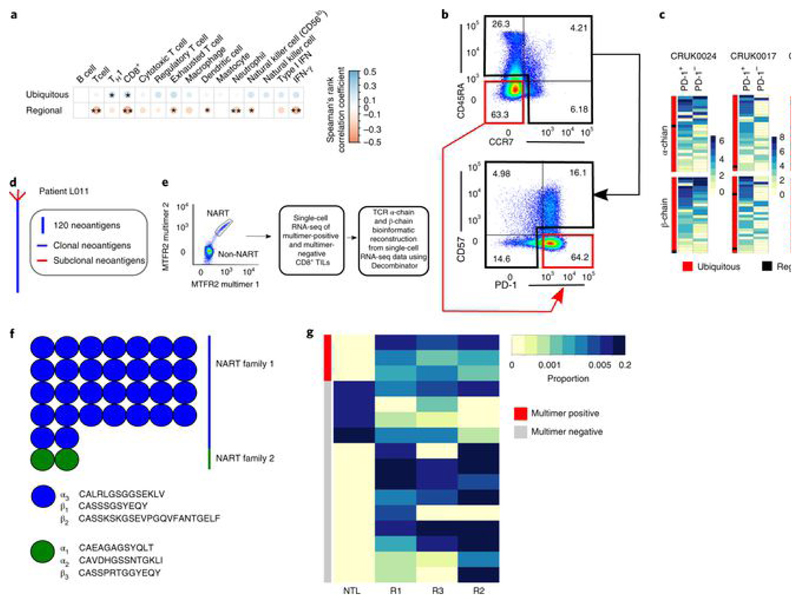
Fig. 4. Expanded intratumoral ubiquitous TCRs are associated with a TH1 and CD8+ T cell transcriptional signature in the tumor and have a phenotype consistent with tumor antigen reactivity.
a, Correlation between the numbers of expanded intratumoral ubiquitous and regional α-chain TCR sequences and the transcriptional expression score (geometric mean) for various immune-related gene sets, characterizing cell types or functional states (names appear above the heat map). Details of how the transcriptional scores are calculated are in the Methods. The area and color of the circles correspond to the magnitude of the Spearman’s rank correlation coefficient. *P < 0.05; **P < 0.01; after Bonferroni correction. n = 78 tumor regions. b, CD8+ TILs from CRUK0024, CRUK0017 and CRUK0069 were sorted into two populations: CD45RA−CCR7−PD-1+CD57− and all other CD8+ TILs (referred to as PD-1+ and PD-1− subpopulations, respectively). The flow cytometry gating strategy for a representative patient is shown (pre-gated on live > singlets > CD3+ > CD8+ T cells). c, RNA from sorted populations was extracted and sequenced, and the RNA-seq data were mined for the presence of expanded ubiquitous and regional α-chain and β-chain sequences. The heat maps show the number of times each expanded ubiquitous or regional TCR CDR3 sequence was found in the RNA-seq data from PD-1+ or PD-1− cells, as a proportion of the number of times a constant region sequence of the same length was detected. The color key gives the proportions scaled for each row, where each row represents a distinct expanded TCR sequence. d, CD8+ T cells reactive to a clonal neoantigen were isolated from a patient with a high clonal nonsynonymous mutational load (patient L011). Phylogenetic tree of tumor adapted from ref. [3]. e, Representative dot plot of the TIL peptide:multimer sorting strategy (left) and the workflow for single-cell RNA-seq (right). CD8+ TILs were screened for neoantigen-reactive T cells (NARTs) reactive to a peptide arising from the mutated MTFR2 gene and sorted for single-cell RNA-seq (pre-gated on lymphocyte > single cell > viable > CD3+CD8+ T cells). f, TCR α-chain and β-chain sequences were bioinformatically reconstructed from the single cells with Decombinator (see Methods). The neoantigen-reactive T cells comprised two families of cells with distinct CDR3 sequences and abundances. g, Heat map showing the abundance of antigen-specific β-chain sequences in tumor regions (Rl–R3) and nontumor lung from multimer-positive (red) and multimer-negative (gray) cells within the bulk TCR sequencing data. Each row represents a unique TCR found in the multimer-positive or multimer-negative single cells.

