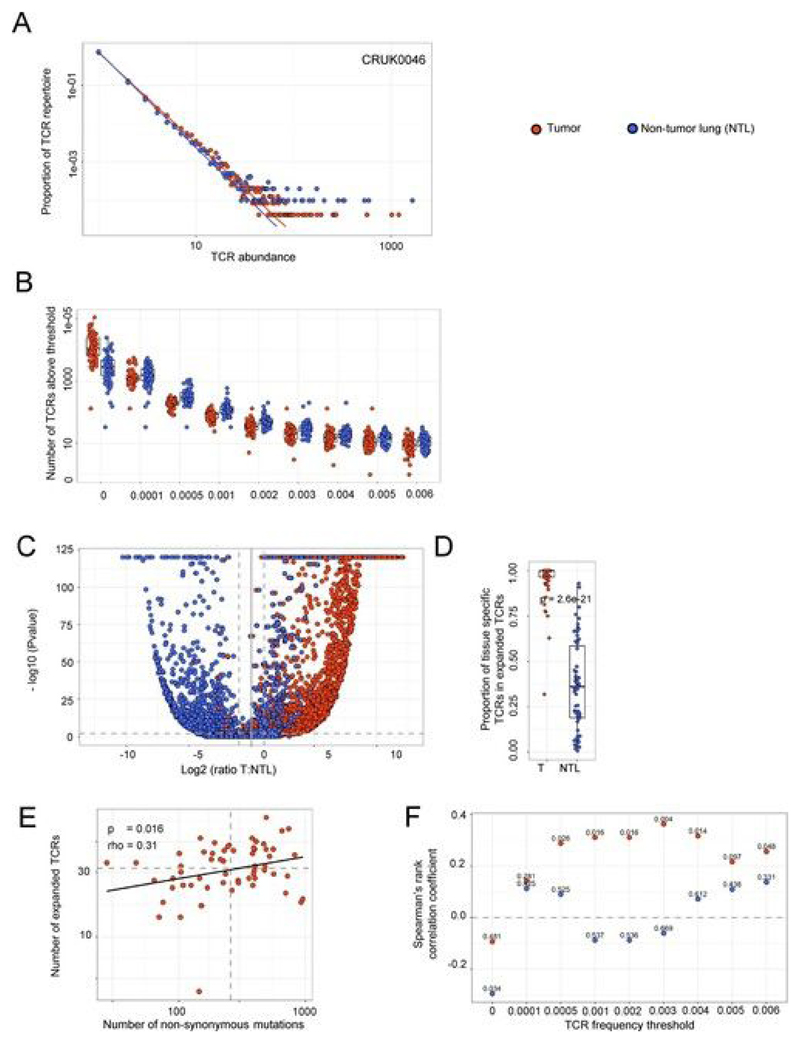
Extended Data Fig. 3. NSCLC tumors contain expanded TCR β-chain sequences that are differentially expressed in tumor as compared to nontumor lung and whose numbers correlate with tumor mutational burden.
a, The frequency distribution of TCR β-chain abundance was fitted to a power law (f=kα) with maximum likelihood. The figure shows a representative plot (patient CRUK0046) for β-chain sequences from pooled tumor regions (red circles) and the matched nontumor lung sample (blue circles). The average power law parameter α, which corresponds to the slope on a log–log plot, was 2.5 ± 0.05 for tumor and 2.6 ± 0.03 for nontumor. The x axis refers to TCR abundance (size of clone), and the y axis refers to the proportion of the repertoire. b, The number of β-chain sequences detected above a given frequency threshold is shown for tumor (n = 72, multiple tumor regions were pooled from an individual patient; red circles) and matched nontumor lung samples (n = 64; blue circles). c, A volcano plot showing the likelihood (−log10 (P value)) of a β-chain sequence being sampled from two populations of equal mean in tumor and nontumor lung, plotted against the differential expression in tumor versus nontumor lung. If the log likelihood was >120, it was given a value of 120 for plotting purposes. Blue circles represent β-chain sequences expanded (>0.002) in nontumor lung; red circles represent β-chain sequences expanded in tumor lung. d, The proportion of expanded tumor α-chain sequences (T) or expanded nontumor lung β-chain sequences (NTL) that are specific to their respective tissue; this is defined on the volcano plot as TCRs that have a P value <0.01 and a differential abundance of at least two between the tissues. The two proportions are significantly different, with the Mann–Whitney P value shown; n(tumor) = 72; n(nontumor lung) = 64. e, The correlation between the number of unique intratumoral expanded β-chain sequences (frequency ≥2/1,000) and the number of nonsynonymous mutations is shown for all patients. The Spearman’s rank correlation and P value are shown (n = 62). f, The Spearman’s rank correlation coefficient and P value (shown above each point; n = 62) are shown for the relationship between the number of unique intratumoral expanded β-chain sequences at different frequencies (ranging from all TCRs (threshold of zero) up to those found at frequency ≥ 8/1,000) and the number of nonsynonymous mutations.

