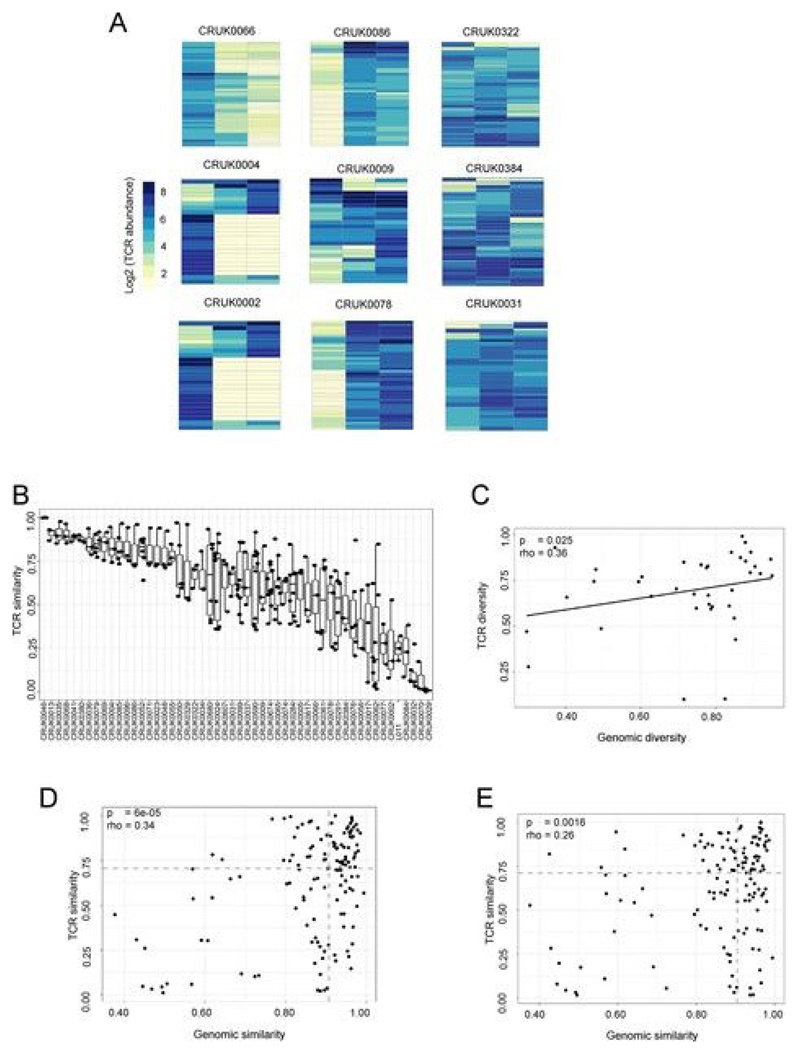
Extended Data Fig. 4. The heterogeneity of TCR repertoires across different regions of tumors differs between patients and correlates with genomic heterogeneity.
a, The heat maps show the abundance (log2 of the number of times each TCR is found) of expanded intratumoral β-chain sequences (frequency ≥ 2/l,000) in different tumor regions for several patients. Patient ID is shown above each heat map. Each row represents one unique sequence. Each column represents one tumor region. b, The TCR repertoire of multiple regions of a patient’s tumor were sequenced and a pairwise comparison of the repertoires of different regions of the same tumor was performed by using the cosine similarity (see Methods). The pairwise intratumoral TCR repertoire similarity (β-chain sequences) is shown for each patient. Each circle represents a comparison between two regions of the same patient’s tumor. Patients are ordered by descending rank of mean intratumoral TCR similarity. c, TCR repertoire (β-chain sequences) diversity plotted against genomic diversity for each patient. The diversity measurement is calculated as the normalized Shannon entropy as described in the Methods. The Spearman’s rank correlation and P value are shown; n = 41. d,e, TCR repertoire for α-chain (d) and β-chain (e) sequence pairwise similarity plotted against genomic similarity for each pair of tumor regions (within patient comparison). The TCR and mutational pairwise similarities are both measured as cosine similarity, as described in the Methods. The Spearman’s rank correlation and P value are shown; n = 226. Dashed lines represent median values.

