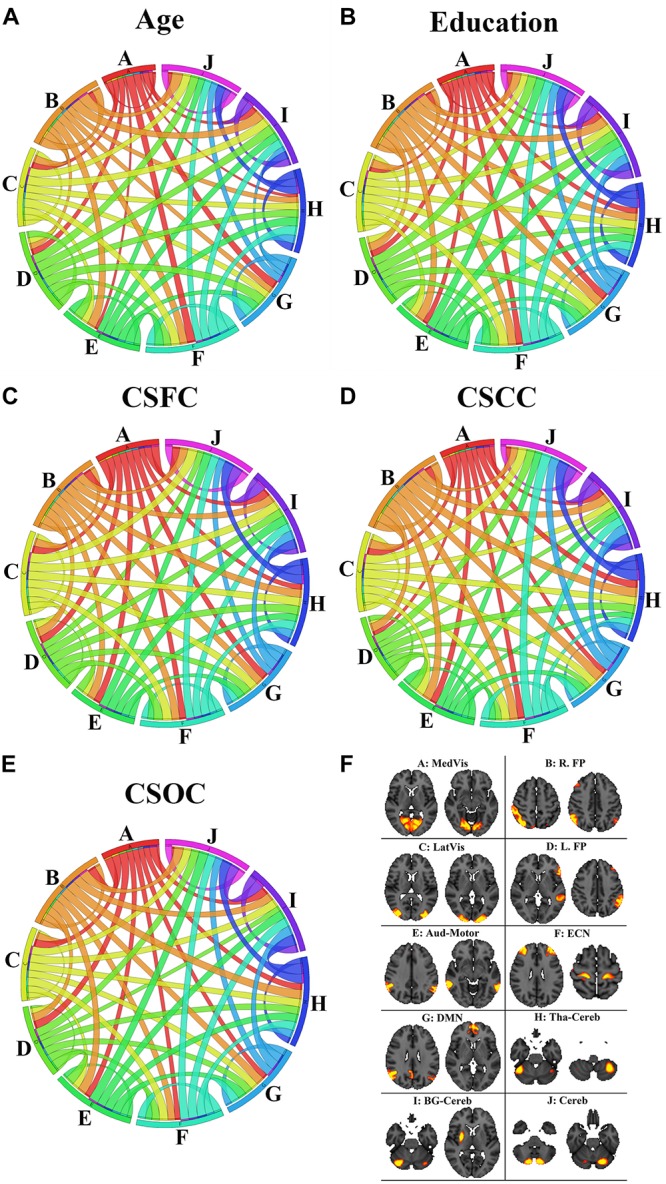
FIGURE 9.

The contribution of the RSFCs to the estimation of age (A), education (B), CSFC (C), CSCC (D), and CSOC (E). The circular diagram indicates the relative contribution of the functional networks, with each functional network indicated by one color. The networks are the medial visual network (A: MedVis), the right fronto-parietal network (B: R. FP), the lateral visual network (C: LatVis), the left fronto-parietal network (D: L. FP), the auditory motor network (E: Aud-Mot), the executive control network (F: ECN), the default mode network (G: DMN), the thalamus cerebellum network (H: Tha-Cereb), the basal ganglia cerebellum network (I: BG-Cereb) and the cerebellum (J: Cereb). Two typical spatial maps of each network can be found in subfigure (F). Each ribbon links two functional networks, and the ribbon size scales with the contribution of the RSFCs between the networks it linked.
