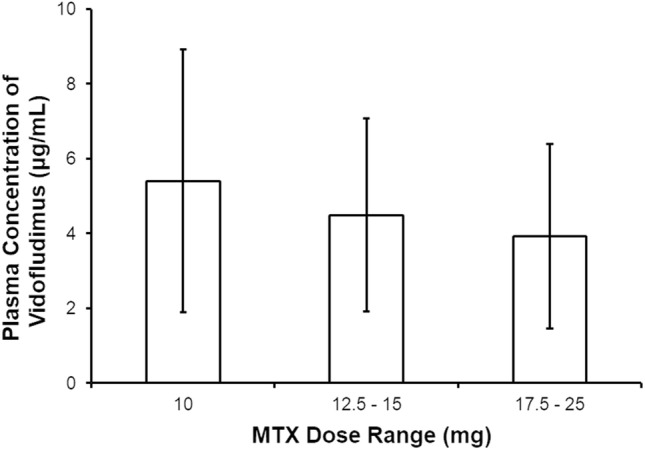
Fig. 2.

Median plasma trough concentration of vidofludimus per patient over all visits by weekly methotrexate dose group. Data are presented as mean ± SD. Analysis based on the Jonckheere–Terpstra test consistently showed that vidofludimus median trough values per patient were significantly lower with increasing methotrexate concentrations (p = 0.023). SD standard deviation
