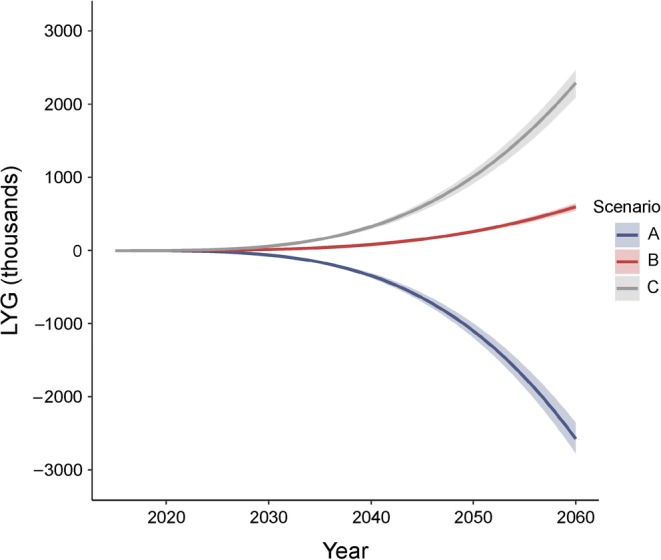
Fig. 2.

Cumulative number of LYG for modelled scenarios (thousands) for England and Wales, population aged ≥65. The shading represents 95% UIs. Scenarios: A, 49% increase in diabetes by 2060; B, 20% increase in diabetes by 2060; C, 7% increase in diabetes by 2060
