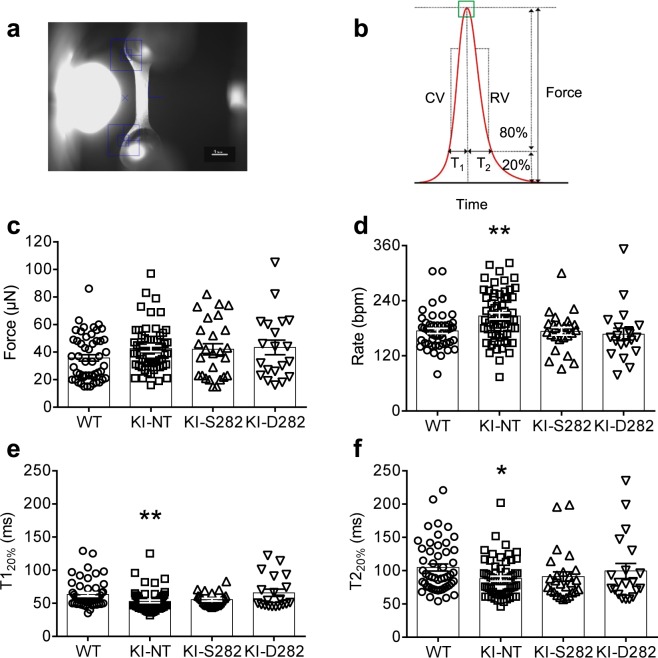
Figure 3.
Analysis of contractile parameters in EHTs under spontaneous contraction with video-optical recording. (a) A representative image of an EHT as recorded by the video camera within the analysis software and evaluated by automated figure recognition (blue squares). Measurements were performed in EHT culture medium containing 1.8 mM external [Ca2+]. (b) Schematic contraction peak displaying the evaluated parameters of force, time to contraction (T120%) and time to relaxation (T220%), contraction velocity (CV) and relaxation velocity (RV). (c) Maximal forces under spontaneous beating activity of EHTs of different genotypes. Maximal force values were recorded on the day of highest force development. (d) Rate of spontaneous beating of EHTs on the day of highest force development (e) Contraction time (T120%) and (f) relaxation time (T220%) were measured from baseline to 20% of peak height and from peak height to 20% of baseline, respectively, in all EHT groups. Data are expressed as mean ± SEM. Numbers of EHTs/batches in all panels: WT 51/5; KI-NT 61/7; KI-S282 26/5; KI-D282 20/5. *P < 0.05 and **P < 0.01 vs. WT, one-way ANOVA plus Dunnett’s multiple comparisons test (KI-NT, S282 and D282 vs WT EHTs).

