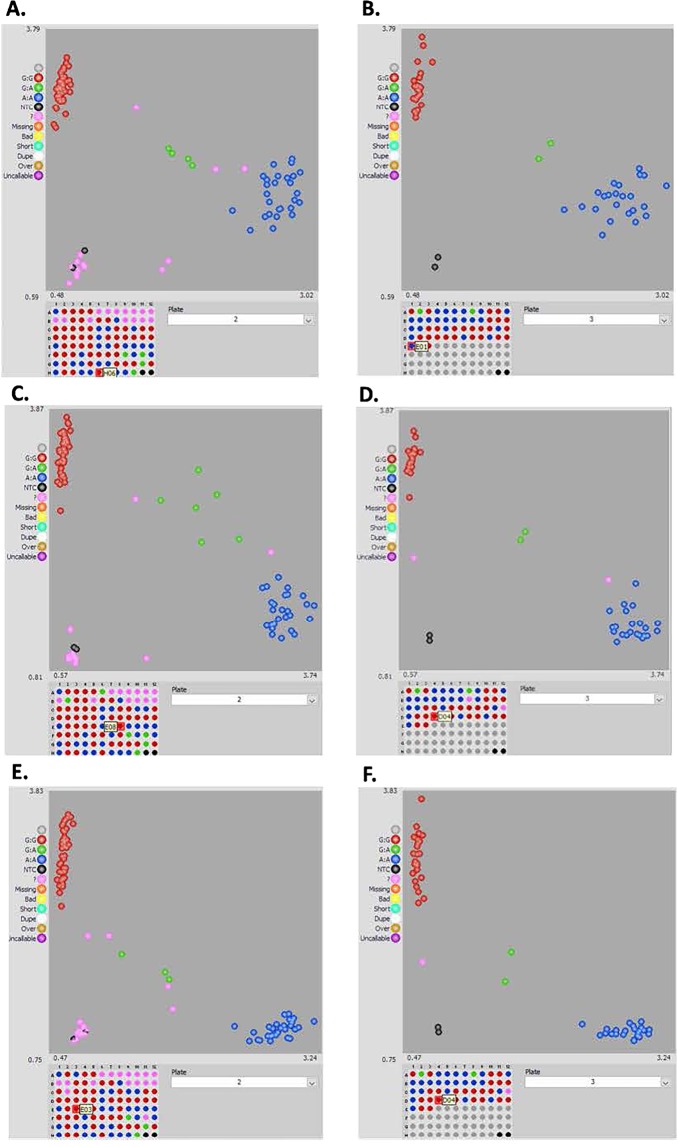
Figure 7.
Representation of KASP genotyping assays using SNP markers flanking the QTL for resistance to TSWV on chromosome A01. Different types of validation of SNPs within or close to the bin marker flanking the major QTL. (A,B) shows KASP assay using SNP A01_9530252; (C,D) shows KASP assay of SNP A01_9604392; (E,F) shows KASP results of SNP A01_9192862 in the RIL population. The genotyping data for each type were viewed using the software of SNPviewer (LGC Genomics). The scatter plots for the X and Y axes were representing the alleles for a marker in the RIL population. The blue and red clusters were the homozygous alleles showing polymorphism.

