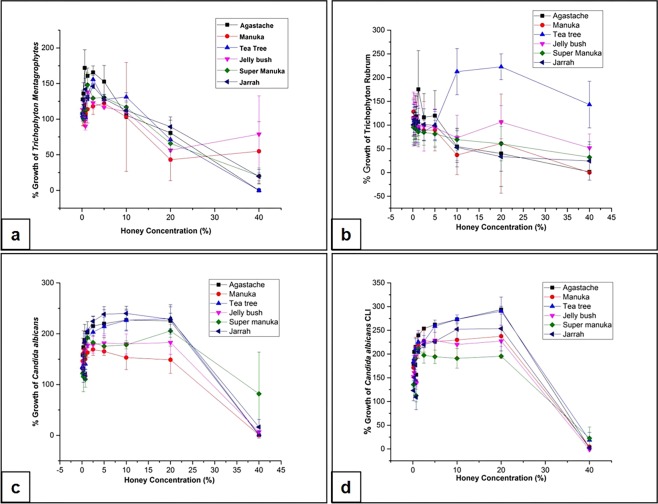
Figure 3.
Antifungal activity of honeys measured by broth dilution. The graph shows the amount of growth (%) after exposure to honey at concentrations ranging from 0% to 40%. Agastache (square, black); Manuka (circle, red); Tea-tree (upwards triangle, blue); Jelly bush (downwards triangle, pink); Super Manuka (diamond, green); Jarrah (left triangle, navy) against T. mentagrophytes (a), T. rubrum (b), C. albicans ATCC 10231 (c) and a clinical isolate of C. albicans (d). Each point represents the mean of triplicate readings ± standard deviations (SD).

