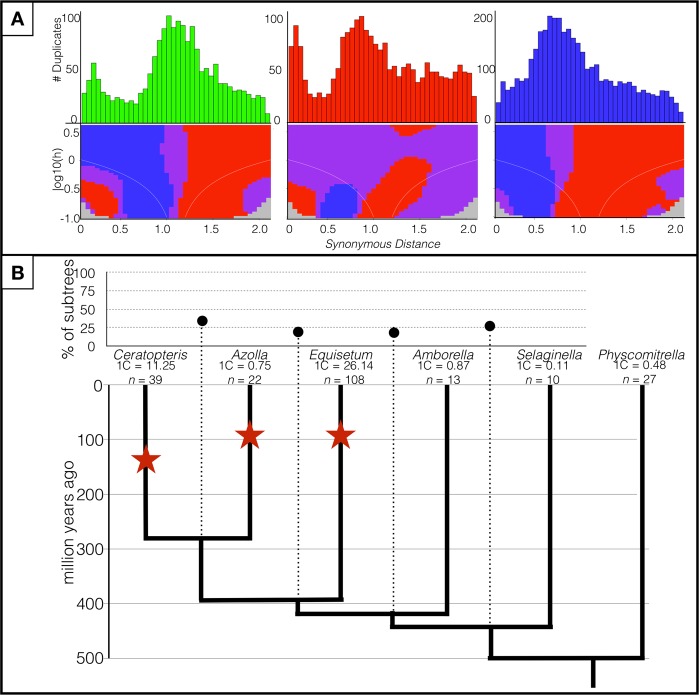
Figure 1.
Polyploidy analyses of three fern species. (A) Paralog-age distribution analyses and associated SiZER plots of three fern species. Upper panels are Ks-based histograms (0.05 bins) of paralogs in Ceratopteris richardii, Azolla filiculoides, and Equisetum giganteum. Lower panels are SiZER plots of the above paralog-age distribution data and associated smoothing functions where blue indicates significant (α = 0.05) increases, red significant decreases, purple insignificance, and gray too few data points to determine. The white lines show the effective window widths for each bandwidth. Both upper and lower panels are on the same x-axis. (B) MAPS analysis across land plants and the associated WGD events (shown as stars). The percentages of subtrees that contain gene duplications shared by the descendent species of a given node are above the phylogeny (connected by dotted lines). Dates are based on Testo and Sundue70 and Morris et al.67.

