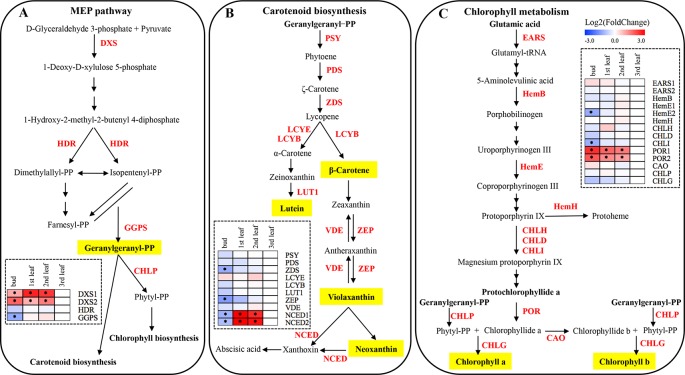
Figure 3.
MEP, carotenoid and chlorophyll biosynthetic pathways in plants, and expression patterns of genes related to pigment metabolism in ‘Xiaoxueya’ leaves. (A) Genes involved in the MEP biosynthetic pathway. (B) Genes involved in the carotenoid biosynthetic pathway. (C) Genes involved in the chlorophyll biosynthetic pathway. Genes used for expression analysis are shown in red. The heat maps were generated using the mean of three replicates and MeV software. The blue-white-red schemes are labelled above the heat map. Red and blue represent relatively high and low expression levels, respectively, compared to those shown in white. Asterisks (*) indicate significant differences (p value ≤ 0.05) and |log2FoldChange| ≥ 1 between the values from the sample and third leaf.

