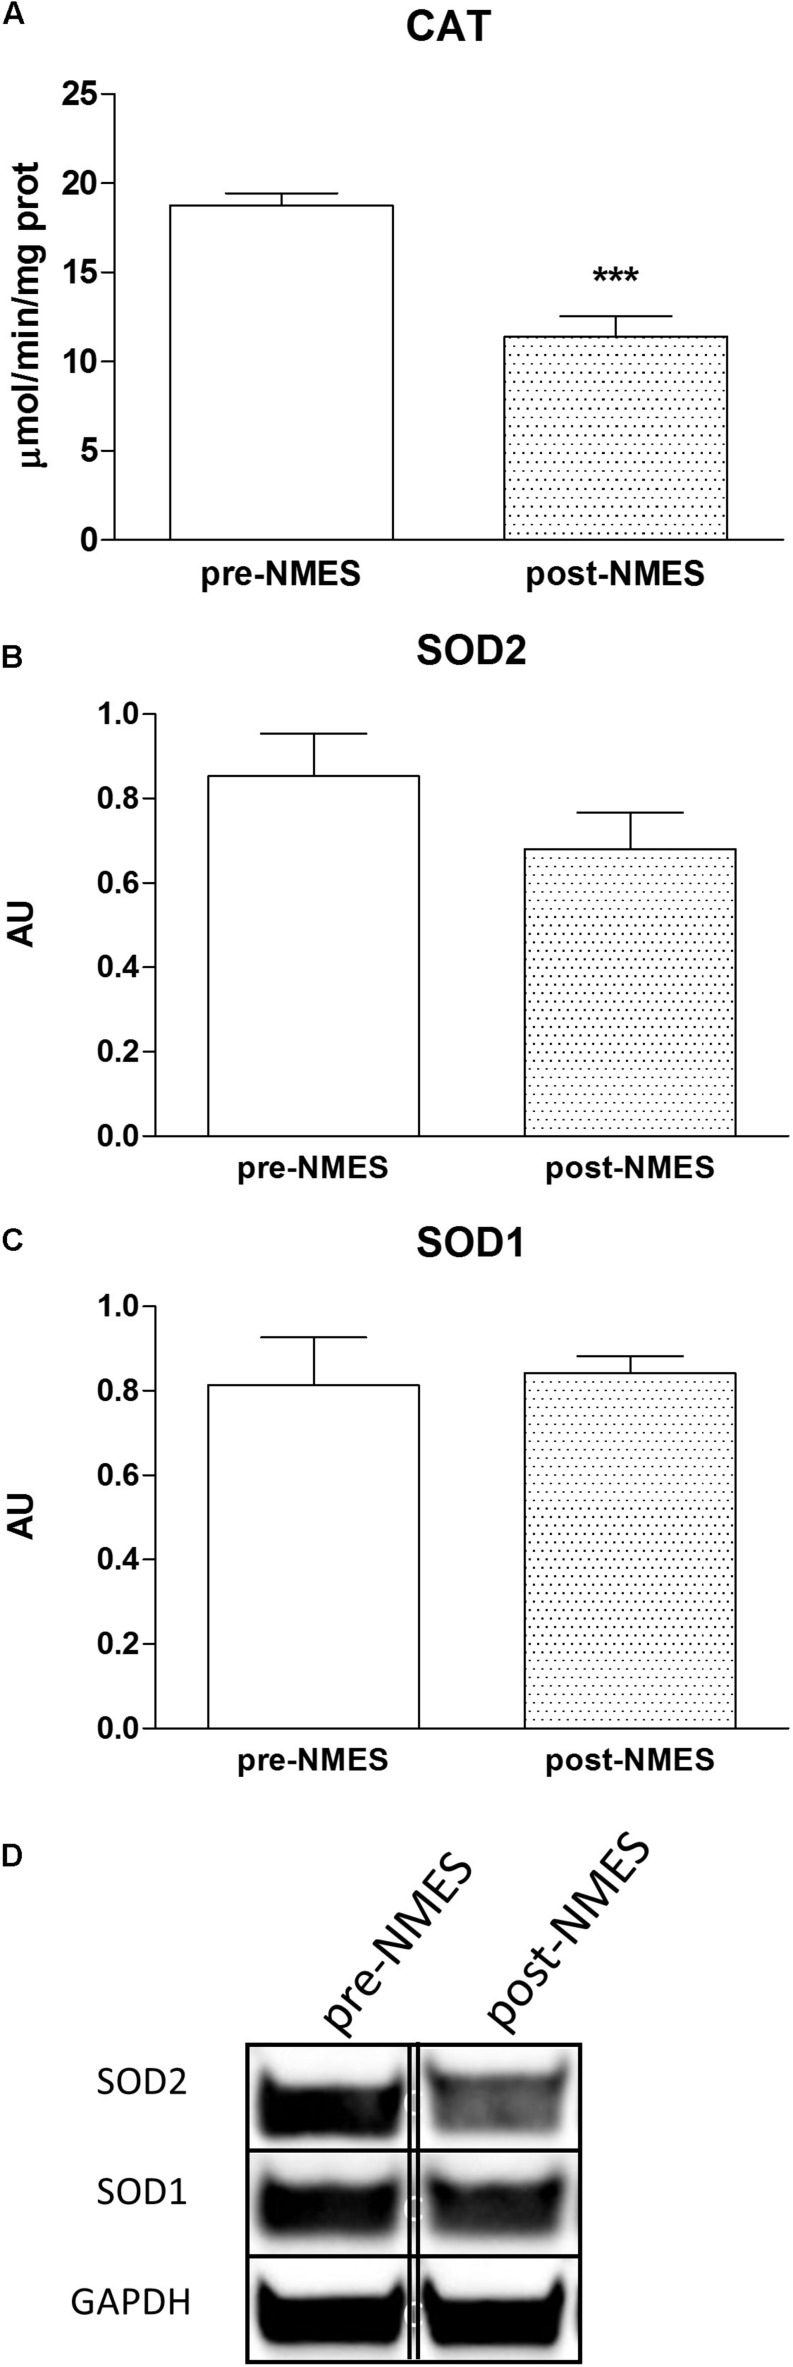
FIGURE 3.
Catalase cytosolic enzymatic activities and SOD Western blotting. In (A) is reported the Catalase enzymatic activity in pre- and post-NMES samples as μmol/min/ng prot (n = 9). ∗∗∗p = 0.0005. Data (n = 5 subjects) are mean ± SEM of three independent experiments in triplicates. (B,C) Show SOD2 and SOD1 densitometric analysis of Western blots performed on four pre-NMES and post-NMES samples expressed as mean ± SD. AU, arbitrary units. The bands (of the same subject) were taken from two nonadjacent lanes originating from exactly the same gel and blot with the same exposure time, but spliced together indicated by double-dotted lines. No change in contrast has been performed. Western Blotting analysis of representative bands of SOD2 and SOD1 (D), of skeletal muscle biopsies pre- and post-NMES.

