Figure 1.
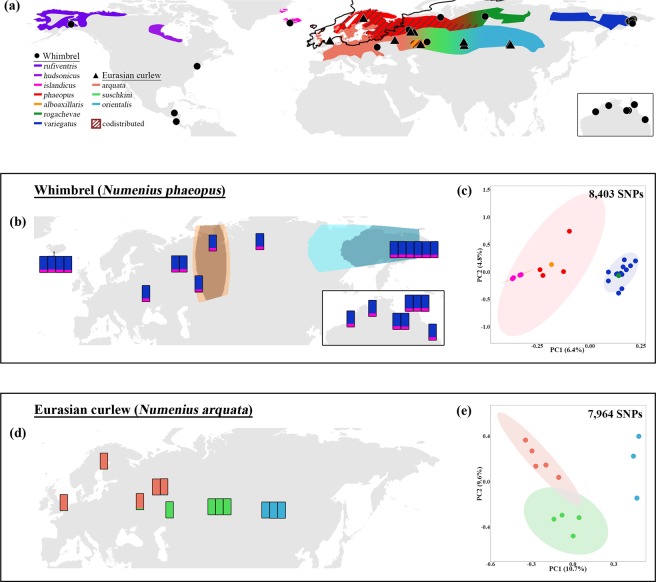
(a) Distribution of breeding areas and sampling localities of whimbrel (Numenius phaeopus) and Eurasian curlew (N. arquata). Each circle or triangle symbol represents a sampled individual. The black lines across Europe represent the maximum extent of the European ice sheet at the last glacial maximum70. (b) Coloured bars represent Structure results at K = 2 for Palaearctic whimbrels. Each bar represents the results for an individual at its approximate sampling locality. Orange and blue polygons represent barriers and corridors to gene flow, respectively, as identified by EEMS. Dark and light shades represent posterior probabilities of >0.95 and >0.90, respectively. The inset shows the results for whimbrels sampled from Australia. (c) Principal component (PC) analysis of Palaearctic whimbrels, with percentage of variation of the two most important PCs. Ellipses represent 95% confidence intervals. Due to low sample size, no ellipses were calculated for N. p. alboaxillaris, and rogachevae. Colours correspond to the breeding populations in (a). (d) Coloured bars represent Structure results at K = 3 for Eurasian curlews. Each bar represents the results for an individual at its approximate sampling locality. No significant barriers or corridors were identified by EEMS. (e) PC analysis of Eurasian curlews, with percentage of variation of the two most important PCs. Ellipses represent 95% confidence intervals. Due to low sample size, no ellipses were calculated for N. a. orientalis. Colours correspond to the breeding populations in (a).

