Figure 2.
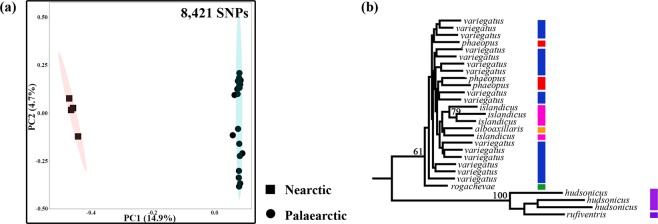
(a) Principal component (PC) analysis of all whimbrels, with percentage of variation for the two most important PCs, including Nearctic (N. p. hudsonicus and rufiventris) and Palaearctic (N. p. phaeopus, islandicus, alboaxillaris, rogachevae and variegatus) populations. Ellipses represent 95% confidence intervals. (b) Maximum likelihood tree of all whimbrels using 438,477 bp of sequence data. Only bootstrap support >50 is displayed. Colours of the bars at the terminal ends of branches correspond to the breeding populations in Fig. 1a.

