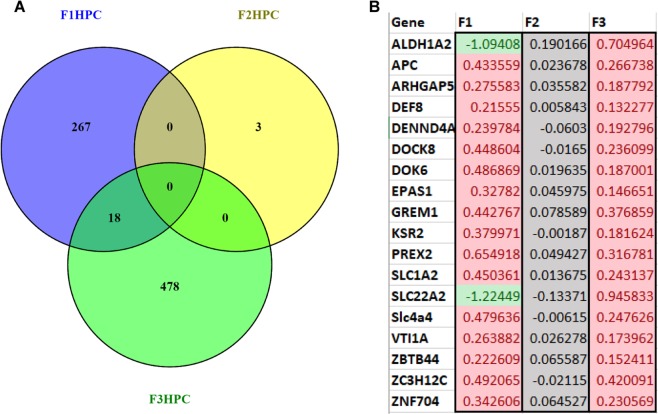
Figure 1.
(A) Venn diagram illustrating the number of genes that are significantly differentially expressed in the HPC of young female F1-F3 offspring following prenatal synthetic glucocorticoid treatment of the F0 pregnancy and the number of genes that overlap between generations (Veh F1 (n = 6), F2 (6), F3 (6); sGC F1 (5), F2 (6), F3 (7)). (B) Heatmap of the 18 genes that are differentially expressed in F1 and F3 female offspring. Values indicate the log-fold change in gene expression in sGC animals relative to control, color further indicates the direction of change (green: significantly down-regulated; red: significantly up-regulated; grey: not significant).

