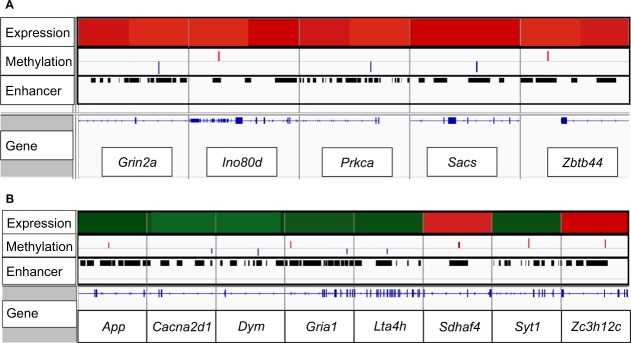
Figure 4.
Visualization of significant differences in expression and DNA methylation, overlaid with genomic loci in (A) F1 and (B) F3. Top row represents significant changes in gene expression associated with prenatal sGC. Red indicates significantly increased expression (FDR < 0.05), green indicates significantly decreased expression (FDR < 0.05). Second row represents significant changes in methylation. Blue indicates significantly decreased methylation (>10%, FDR < 0.05), red indicates significantly increased methylation (>10%, FDR < 0.05). Enhancer row identifies which regions of the genome were captured as enhancers. Gene tracks are represented above the gene names in blue, with horizontal lines representing intron sequences and coding exons represented by blocks.

