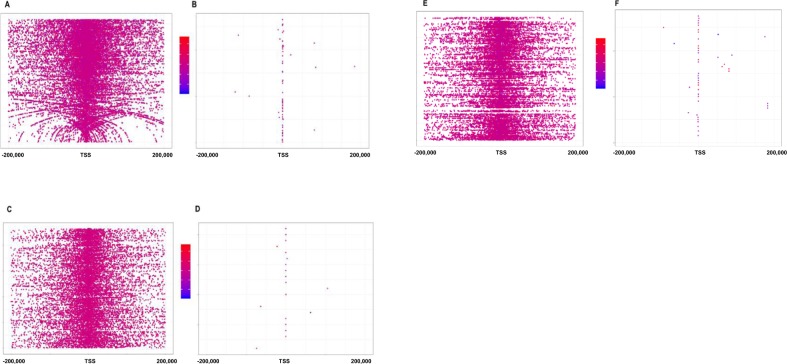
Figure 5.
CpG distributions with respect to transcription start sites (TSS) in (A) F1 distribution of all CpG sites captured with respect to distance to TSS. (B) Distribution of significantly differentially methylated CpGs in F1 (p < 0.05, FDR < 0.05) with respect to distance to TSS. (C) F2 distribution of all CpG sites captured with respect to distance to TSS. (D) Distribution of significantly differentially methylated CpGs in F2 (p < 0.05, FDR < 0.05) with respect to distance to TSS. (E) F3 distribution of all CpG sites captured with respect to distance to TSS. (F) Distribution of significantly differentially methylated CpGs in F3 (p < 0.05, FDR < 0.05) with respect to distance to TSS. Red indicates increased methylation, while blue indicates decreased methylation. Veh F1 (n = 6), F2 (6), F3 (7); sGC F1 (6), F2 (6), F3 (5).

