Figure 3.

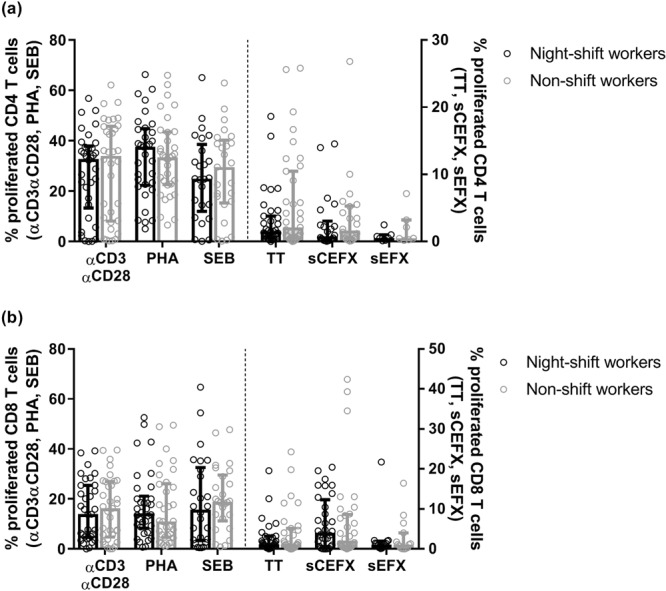
Percentages proliferated CD4 T cells (a) and CD8 T cells (b) in night-shift workers (black) and non-shift workers (grey) among the responders (>0% stimulus-specific T cell proliferation). Bars indicate median with interquartile range.

Percentages proliferated CD4 T cells (a) and CD8 T cells (b) in night-shift workers (black) and non-shift workers (grey) among the responders (>0% stimulus-specific T cell proliferation). Bars indicate median with interquartile range.