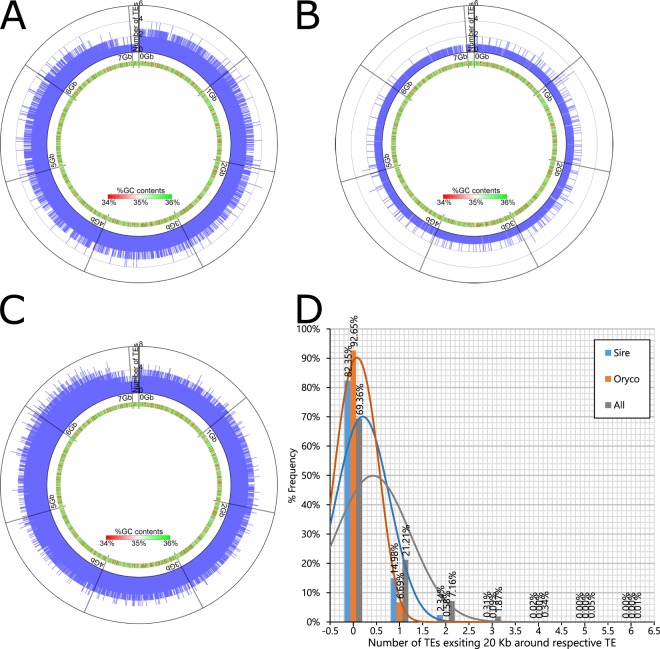
Figure 4.
The distribution of transposable elements (TEs) in the T. cinerariifolium genome. The distributions of TEs for sire (A), oryco (B) and all clade (C) were shown with the circles. The number of TEs coded in each scaffold regions within each 20 Kb region was plotted on the outer circle and %GC content in each 20 Kb was represented with heatmap on the inner circle. (D) The number of sire, oryco and all clade existing 20 Kb around respective TE was shown with histogram.

