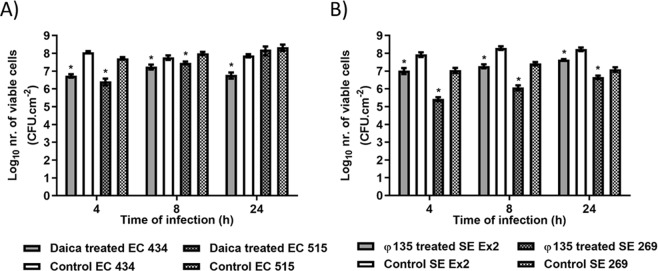
Figure 10.
E. coli (A) and S. Enteritidis (B) single-species biofilms formed for 24 h in 96-well plates at 37 °C treated with phages Daica and φ135, respectively, for 4, 8 and 24 h. (A) Solid bars correspond to EC 434 biofilms treated with Daica (grey) or untreated/control (white) while shaded bars correspond to the control EC515 (white with black squares) or EC 515 treated with Daica (grey with black squares). (B) Solid bars correspond to SE Ex2 biofilms treated with φ135 (grey) or untreated/control (white) while shaded bars correspond to the control SE Ex2 (white with black squares) or SE 269 treated with φ135 (grey with black squares). Statistical analysis of the results was performed using GraphPad Prism 6 (GraphPad Software, La Jolla, CA, USA) using two-way ANOVA followed by Tukey’s multiple comparison statistical test. Asterisks (*) indicate a significant difference (p < 0.05) between phage-treated and control samples.

