Figure 6.

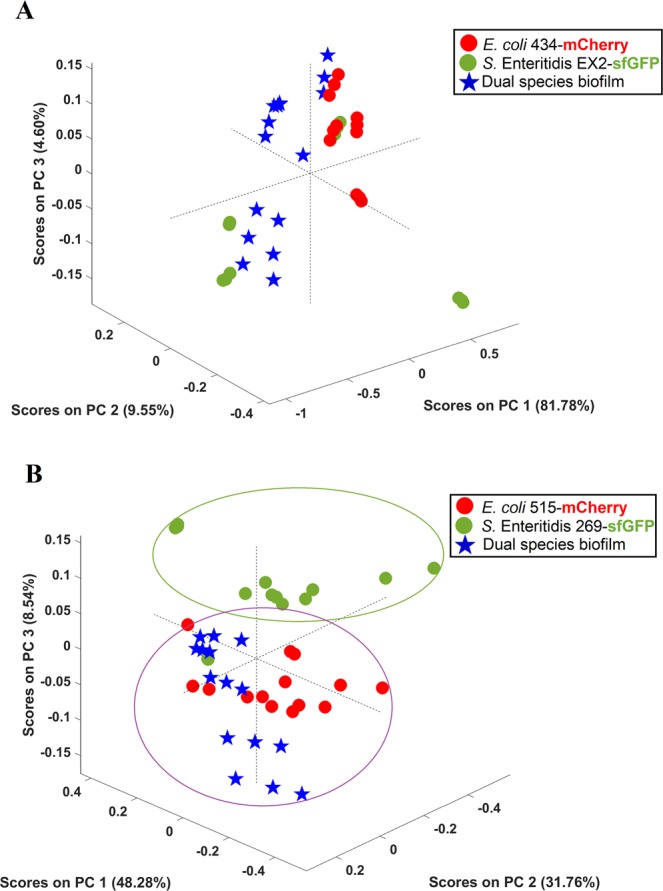
Scores map of the PCA model of the EPS infrared spectra extracted from single- and dual-species biofilms of strong (A) and weak (B) producers. The PCA model was built considering the spectral regions from 3600–2800 cm−1 and 1700–900 cm−1.

Scores map of the PCA model of the EPS infrared spectra extracted from single- and dual-species biofilms of strong (A) and weak (B) producers. The PCA model was built considering the spectral regions from 3600–2800 cm−1 and 1700–900 cm−1.