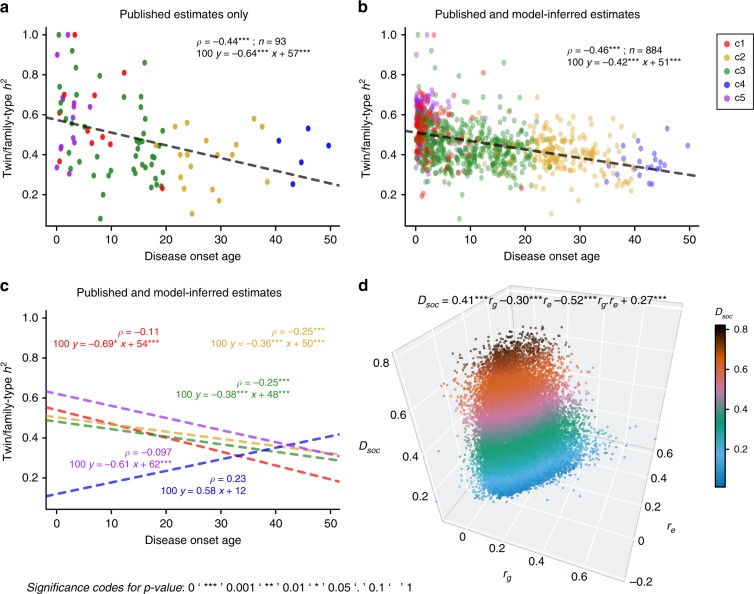
Fig. 4. Analyses empowered by our estimates of heritability (h2), and genetic and environmental correlations (rg and re).
Plate a includes analyses solely based on the previously published estimates of twin/family-type h2, suggesting a significantly negative correlation between disease onset age and heritability. b Our estimator substantially enriched the collection of twin/family-type h2 estimates, filling in numerous missing estimates for under-studied diseases. When we analyzed disease prevalence curves jointly, we found a significantly negative correlation between disease onset age and h2, which also holds for h2 estimates based on other data types, such as SNP/PRS-type (Supplementary Fig. 4b). c We performed the same analysis for diseases within each of the five curve shape clusters, also confirming the significantly negative correlations for shape Clusters 1–3. In the smaller Clusters 4 and 5, the correlations were not significant (Methods part 5). d To understand the relationship between a disease pair’s dissimilarity of disease prevalence curves (Dsoc), and the rg and re for the same disease pair, we performed a regression analysis, expressing Dsoc as a function of rg, re, and an interaction term rg·re (p values were computed using Student’s t test, see Methods part 6). The corresponding regression coefficients turned out to be 0.41, −0.30, and −0.52, respectively. This regression analysis suggests the following: When two diseases have only high genetic correlation, their prevalence curves are likely to be very different; if only environmental correlation is high, the prevalence curves tend to be much more similar. However, disease prevalence curves are most similar when both environmental and genetic correlations between the two diseases are high. The included disease pairs across all categories are represented as hundreds of thousands of data points in the plot and they are colored according to the Dsoc values. We also repeated the same Dsoc regression analysis with all disease pairs from distinct disease categories (see Supplementary Data 6 and Supplementary Fig. 5).

