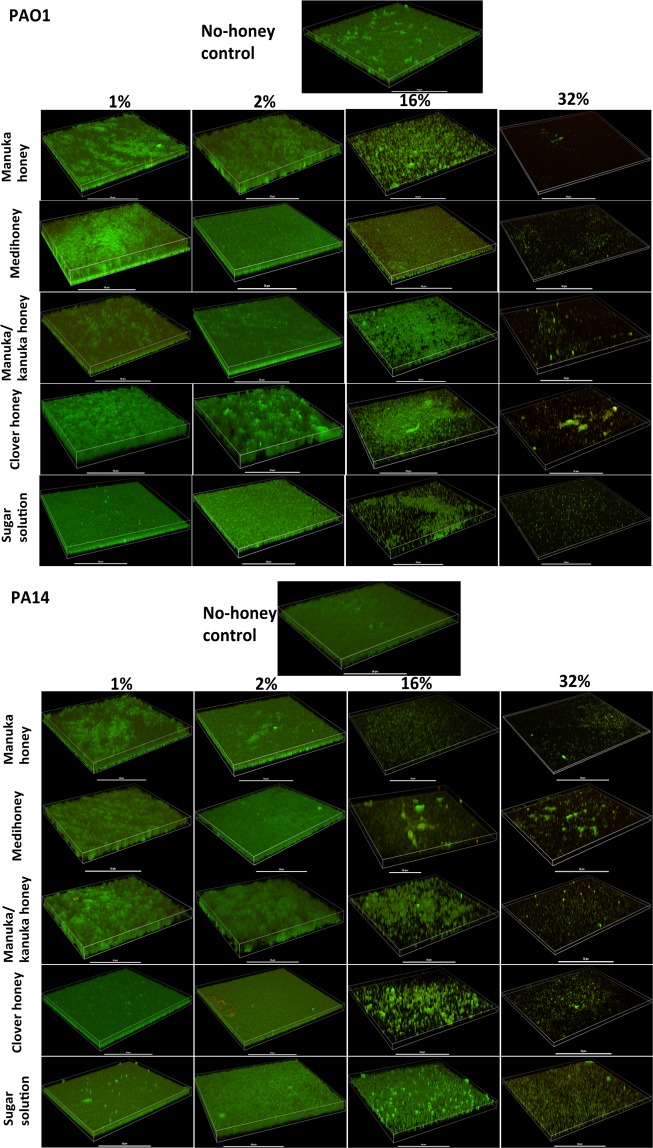
Figure 3.
Visualisation of established P. aeruginosa biofilms treated with different honeys. 3-D images produced by confocal laser scanning microscopy of established P. aeruginosa PAO1 and PA14 biofilms, following treatment with sub-inhibitory (1 and 2%) and inhibitory (16 and 32%) concentrations of NZ honeys (manuka, Medihoney, manuka-kanuka, or clover) or control sugar solution. Biofilms were stained with Syto9 (green = viable cells) and propidium iodine (red = dead cells). Scale bar represents 50 µm.

