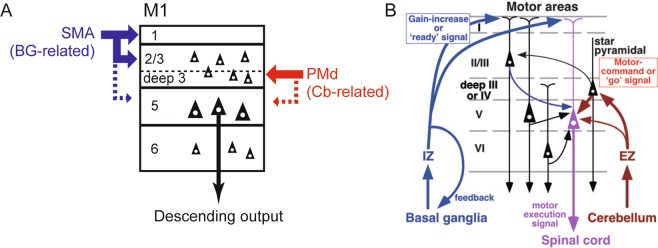
Figure 8.
(A) Schematic diagram of projections from SMA and PMd to M1. The layer-specific inputs from SMA and PMd to M1 are shown in blue and red, respectively. Note that the input from SMA, functionally linked with the basal ganglia (BG), terminates mainly in layers 1 and 2/3 (upper part) and, to a lesser extent, in layer 5 (broken blue line) of M1, whereas the input from PMd, functionally relevant to the cerebellum (Cb), terminates predominantly in layer 2/3 (deeper part) and, additionally, in layer 5 (broken red line). (B) Schematic diagram of motor thalamocortical projections in rodents adopted from Kuramoto et al.20 In the ventral anterior and ventral lateral nuclei of the thalamus, the inhibitory afferent-dominant zone (IZ) and the excitatory afferent-dominant zone (EZ) relay BG-related and Cb-related signals to distinct layers of M1, respectively. Note the similarities of the layer-specific arrangements between SMA-derived and IZ-derived terminals, and between PMd-derived and EZ-derived terminals.

