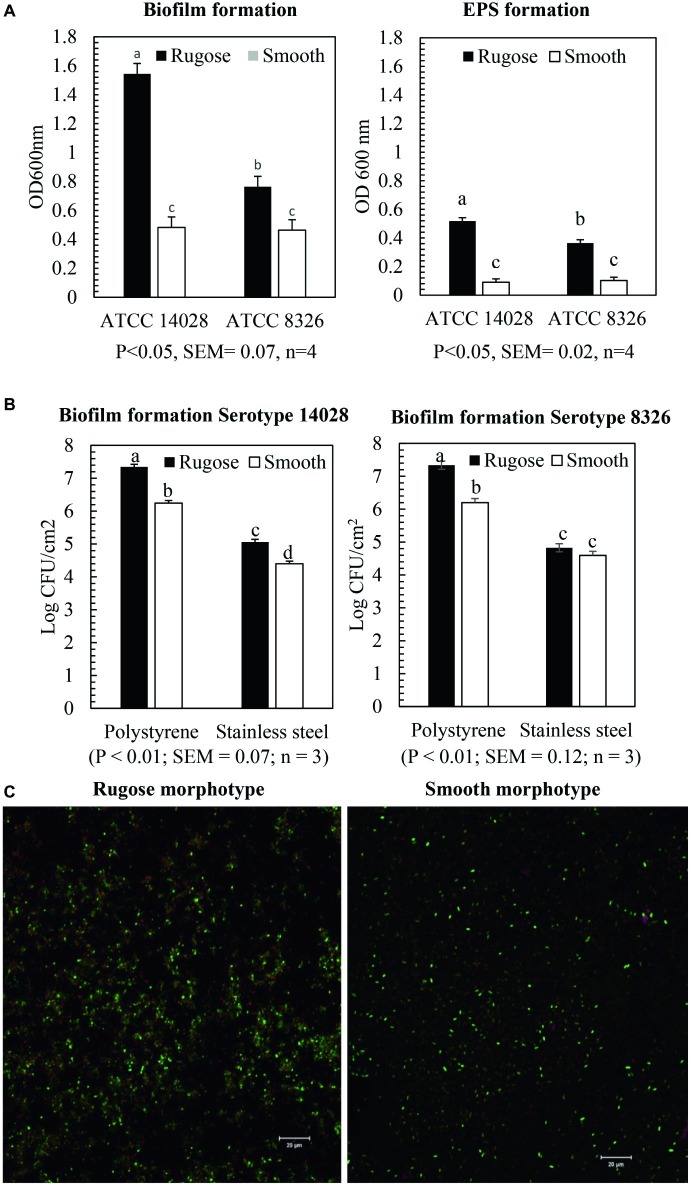
Figure 2.
Biofilm and EPS formation of two morphotypes of S. Typhimurium (ATCC 14028) and S. Heidelberg (ATCC 8326) in 48 h at 25°C. (A) Bars represent average OD600 value of the biofilm and EPS formation on polystyrene surface after staining with crystal violet assay and ruthenium red assay. The black bar represents rugose morphotype and white bar represents smooth morphotype, (B) Bars represent average CFU/cm2 value of cellular density of the biofilm formation on polystyrene surface and SS surface. The black bar represents rugose morphotype and white bar represents smooth morphotype, and (C) Scanning confocal images of biofilms of S. Typhimurium (ATCC 14028) rugose and smooth morphotypes after 48 h at 25°C. Violet color indicates exopolysaccharides, red color indicates protein compounds and green color indicates nucleic acids.

