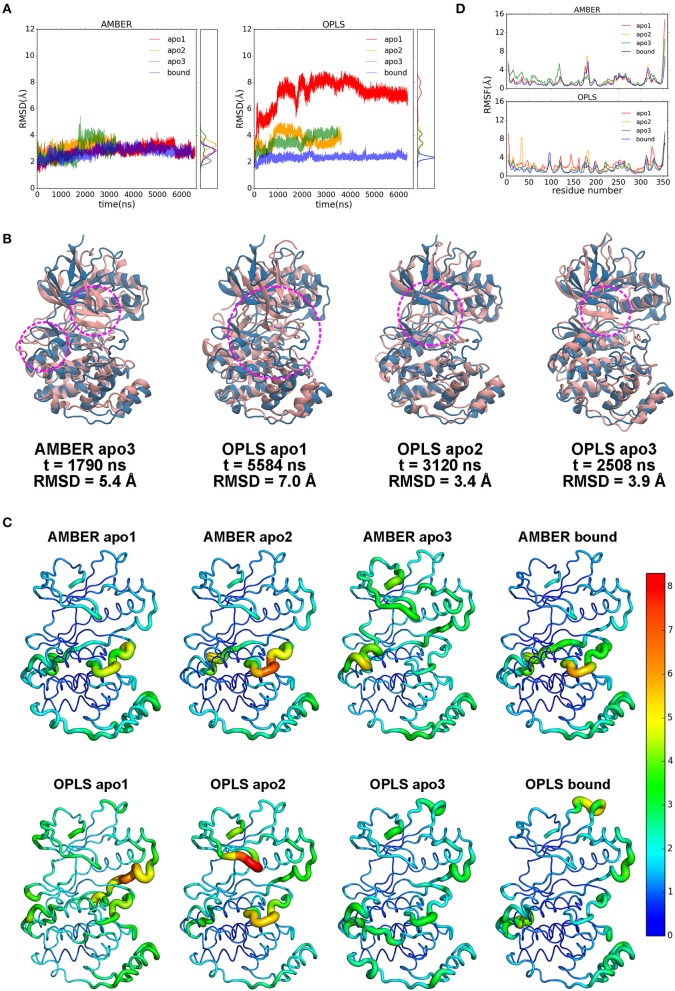
Figure 3.
Dynamics of p38α kinase in MD simulations. (A) RMSDs of p38α in AMBER and OPLS simulations. Three runs of apo p38α (apo1, apo2, and apo3) and one run of ligand-bound p38α are shown in red, orange, green, and blue, respectively. The probability density functions are shown in the right panel. (B) Representative snapshots (pink) aligned to the initial structure (light blue). Regions of interest are marked by magenta circle. (C) RMSFs mapped onto p38α structure. Sausage representation is used for the protein. The thickness of the tube is normalized within each simulation run with thicker tubes corresponding to higher RMSFs. The color of the tube is normalized using all simulation runs using the “rainbow” gradient with warmer color corresponding to higher RMSFs. Color normalization was done by setting the color range to 0–8.3 Å (the largest RMSF value in all simulations). The N-terminal end (residue 4–13) and C-terminal end (residue 345–354) are not shown and excluded from the color normalization for better visualization. (D) RMSFs of p38α backbone in AMBER and OPLS simulations. The color scheme is same as in RMSD.

