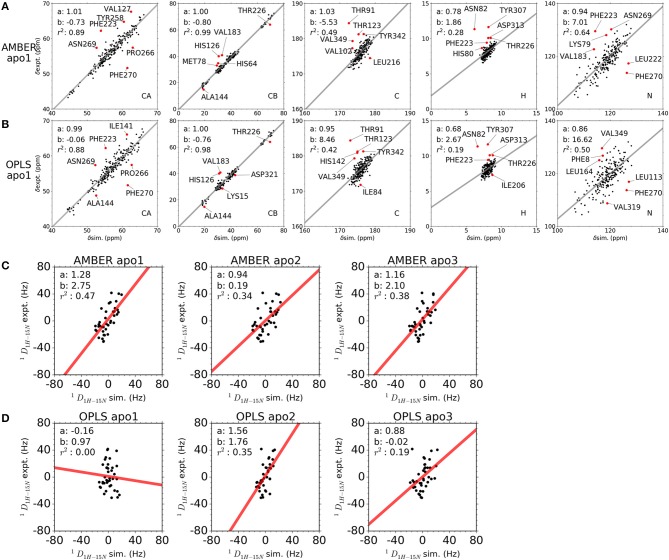
Figure 5.
Comparison between simulated and experimental NMR observables. (A,B) Comparison between simulated and experimental chemical shifts of apo p38α for simulation runs AMBER apo1 and OPLS apo1. Chemical shifts were calculated from MD snapshots at an interval of 1 ns using PPM. The x-axis and y-axis of the correlation plot are the simulated and experimental chemical shifts, respectively. The linear regression lines are shown as gray, with slope a, intersection b, and correlation coefficient r2 shown in top left corner. The top six outlier residues with the largest RMS error are shown as red dots. (C,D) Comparison between simulated and experimental RDCs of apo p38α. Results are shown for all AMBER simulations and OPLS simulations of apo p38α. The x-axis and y-axis of the correlation plot are the simulated and experimental RDCs, respectively. The linear regression lines are shown as red, with slope a, intersection b, and correlation coefficient r2 shown in top left corner.

