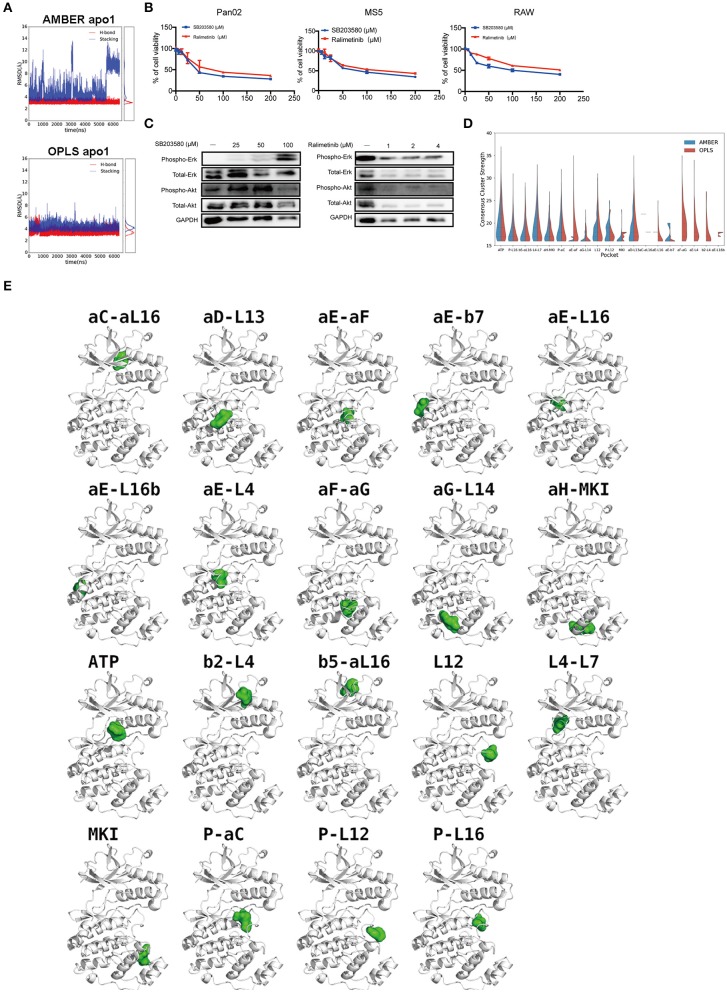
Figure 6.
p38α-SB203580 interaction and potential binding pockets in p38α. (A) Distance plots of hydrogen bond and stacking interactions between p38α and the inhibitor SB203580. The hydrogen bond distance is measured between backbone amide of MET109 and atom NB1 in the inhibitor (red lines). The stacking interaction distance is measured between the center of mass of the six-member ring in TYR35 and the inhibitor (blue lines). Probability density functions are shown in the side panel. (B) Cell viabilities of Pan02, RAW, MS5 cell lines treated with 3.125–50 μM SB203580 for 24 h (n = 6 samples per group). Cell viabilities of Pan02, RAW, MS5 cell lines treated with 1.25–10 μM ralimetinib for 24 h (n = 6 samples per group). (C) SB203580 and ralimetinib inhibit phosphorylation of ERK and AKT at 4 h and 30 min in Pan02 cells. GAPDH indicates the loading level in each lane. (n = 3 samples per group) (D) Violin plot of consensus cluster strength for potential ligand-binding pockets identified from AMBER (blue) and OPLS (red) simulations of apo p38α. Results with consensus cluster strength S ≥ 16 are plotted with quartiles shown as dashed lines inside the violins. Note that for pockets with very few occurrences in simulations, only single lines are displayed. (E) Representative snapshots showing the location of potential ligand-binding pockets identified in FTMap analysis of AMBER and OPLS simulations. p38α protein is shown in white ribbon representation and pockets are indicated by corresponding solvent probes shown in green surface representation. Note that the apo p38α crystal structure (PDB code: 1P38) is used here for consistency in visualization.

