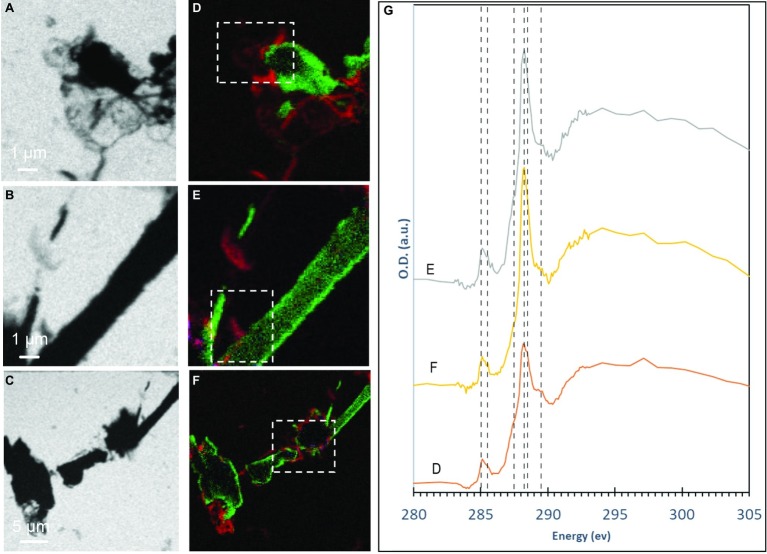
Figure 3.
STXM analyses of S(0) particles produced by S. kujiense in cultures with sulfide and thiosulfate after 5 weeks. (A–C) STXM images collected at carbon K-edge (288.2 eV). (D–F) map overlays: green areas are rich in sulfur and red areas are rich in organic carbon. (G) XANES spectra at the carbon K-edge obtained on the particles shown in panels (D–F) (dashed boxes). Vertical lines in (G) are located at 285 eV and 285.5 eV (1 s → π* transitions in aromatics), 287.44 eV (3 s → σ* transitions in aliphatics), 288.2 eV (1 s → π* transitions in amide groups of proteins), 288.5 eV (1 s → π* transitions in carboxylic groups), and 289.5 eV (1 s → σ* transitions in alcohols).

