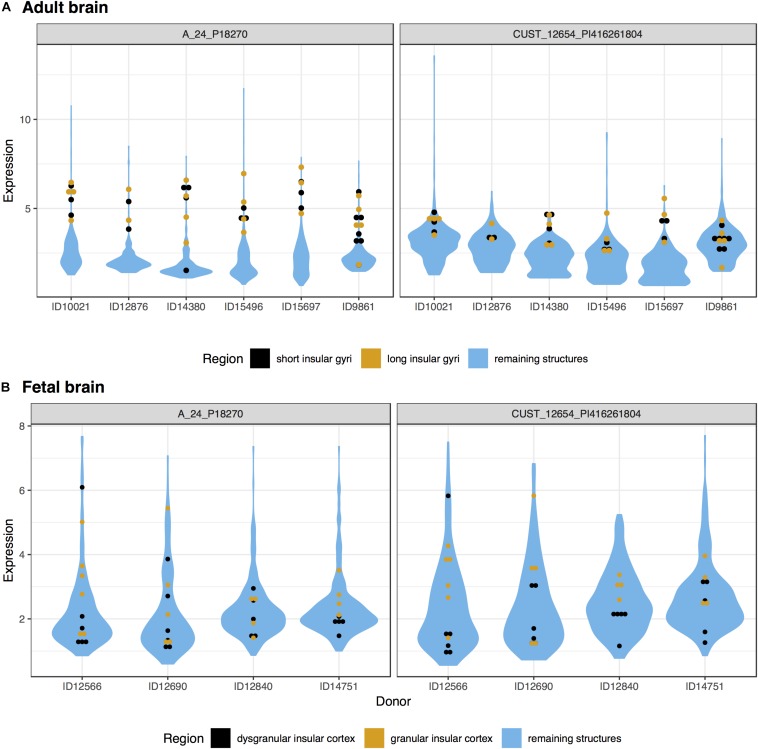
FIGURE 1.
Plots of UCMA expression in the adult (A) and fetal (B) brains. Expression (log2 intensity) is plotted on the y-axis for each of the two probes for UCMA. Donor identification numbers are marked on the x-axis. Expression in the short insular gyri and dysgranular insular cortex is marked in black with orange marking the long and granular divisions. Expression across the remaining brain regions is shown in blue violin plots.

