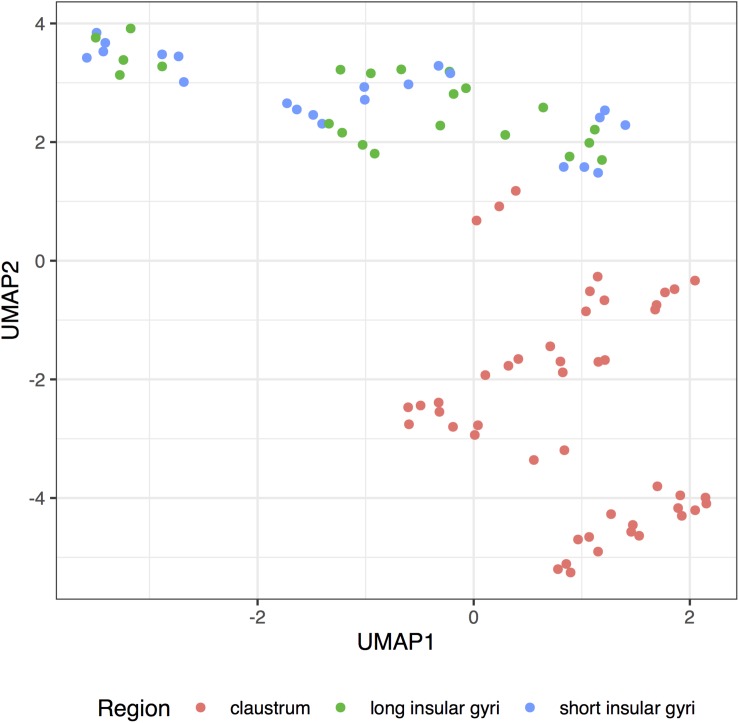
FIGURE 5.
UMAP projection of the insular and clastral samples. Complete transcriptome profiles are reduced to a two-dimensional space (UMAP1 and 2) for visualization. Each dot represents a sample with color marking the sampled region (claustrum: red; long insular gyri: green; long insular gyri: blue).

