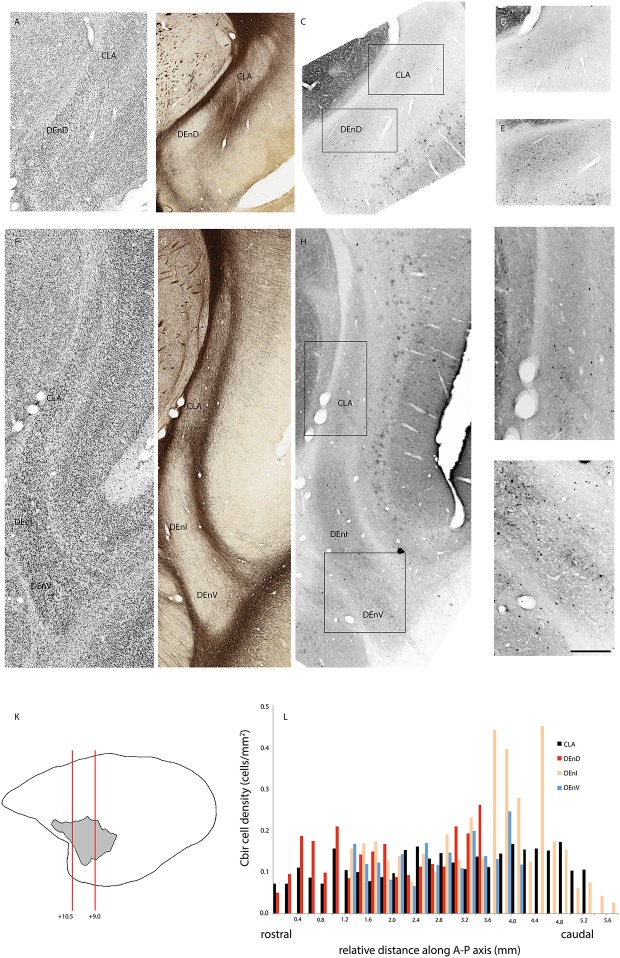
Figure 4.
Adjacent rostral- (A–E) and mid- (F–J) coronal sections of the claustrum complex showing Nissl (A,F); myelin (B,G); and calbindin immunoreactive (C–E,H–J) staining in the CLA and DEnD subdivisions at each level. Rectangles in (C) and (H) indicate the boundaries of the enlarged images in (D–E) and (I–J). Note that the DEnD is not visible in (F–H). Red lines in (K) indicate the location and approximate A-P coordinates for each set of sections in (A–J). Bar graph in (L) shows the density of calbindin immunopositive cells in each subdivision of the claustrum complex for every section in this case (F1741) in which claustrum components were present. X-axis distances were computed with reference to the rostral-most claustrum section, which was assigned a value of 0 mm. Note that not all subdivisions were present in every section examined. Scale bar = 0.5 mm in (A–C,F–H) and ~0.17 mm in (D–E,I–J).

