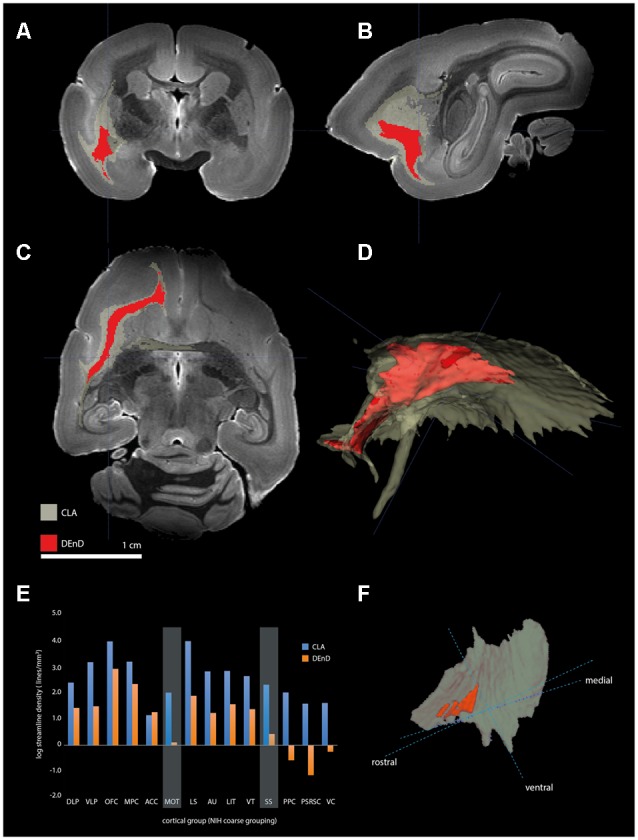
Figure 7.

Tractography of claustrum complex vs. DEnD ROIs. (A–C) Coronal (A), sagittal (B), and horizontal views of streamline patterns emerging from the claustrum complex and dorsal division of the DEnD masks generated from the myeloarchitecture of case CJ197. Blue cross indicates a common point of registration in (A–C). (D) Three-dimensional reconstruction of the streamline pattern in the left hemisphere white matter. The relative size of the seed ROIS is shown in the claustrum complex reconstruction in (F). (E) Bar chart shows the log streamline density to each cortical region outlined in the coarse parcellation of the NIH marmoset atlas (see text for details). Disparity in the relative density of streamlines between the DEnD and remainder of the claustrum complex are highlighted for the motor (MOT) and somatosensory (SS) aggregated areas. The reduction in streamline density between DEnD and caudal cortical aggregates is evident in the posterior parietal (PPC), posterior cingulate/retrosplenial (PSRC), and visual cortex (VC) aggregates, where DEnD connectivity was negligible or absent in this single case.
