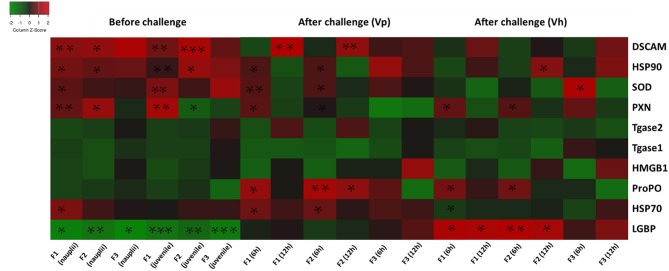
Figure 6.
Heatmap showing transcription levels for innate immune-related genes analyzed in three subsequent brine shrimp generations F1, F2, and F3 originating from phloroglucinol-treated parents. Results for non-infected larvae and juveniles and for larvae infected with V. parahaemolyticus or V. harveyi are presented. Gene upregulation in TF1 to TF3 as compared to CF1 to CF3 is visualized in red and gene downregulation upregulation in TF1 to TF3 as compared to CF1 to CF3 in green. An asterisk * represents a significant difference between the treatment and control groups at each respective generation (*P < 0.05, **P < 0.01, ***P < 0.001).

