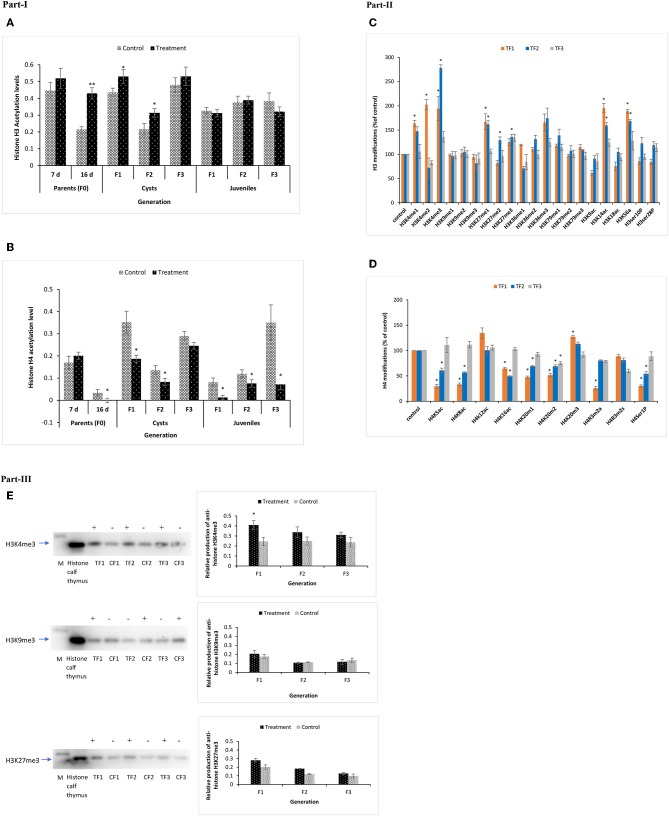
Figure 9.
Total acetylation of histone H3 and H4 and multiple modifications of H3 and H4 in F1 to F3 brine shrimp whose parental generation (TF0) was treated with phloroglucinol or non-treated (CF0). Total histone was extracted from the control and treatments groups (in three biological replicates) of F0 (DAH7 and DAH16) and F1, F2, and F3 generations (cysts and juveniles) by the direct acid extraction method. Part I. Alteration of total H3 (A) and H4 (B) histone acetylation patterns in the brine shrimp parental generation TF0 and three successive generations of brine shrimp cysts and juveniles using a fluorometric kit (Abcam). Statistical data are represented as the mean of three biological replicates, error bars represent the standard deviation (n = 3), and significant differences (P < 0.05) between control and treatment groups are indicated with an asterisk (*). Part II. Multiple histone H3 and H4 modified proteins in F1–F3 brine shrimp cysts. (C) H3 Histone 21 post-translational modification states were analyzed from cysts of treatment and control groups. Results showed significantly altered histone modifications in TF1, TF2, and TF3 generations as compared to the respective controls. (D) H4 Histone 10 post-translational modifications were analyzed in cysts of both the treatment and control group and results showed significantly altered histone modifications in TF1, TF2, and TF3 generations as compared to the respective controls. Statistical data are presented as the standard deviation (n = 2), and significant differences (P < 0.05) between control and treatment groups are indicated with an asterisk (*). Part III. Elevated H3K4me3 and H3K27me3 levels and decreased H3K9me3 levels in TF1–TF3 brine shrimp were verified by Western blotting. Western blotting was performed for H3K4me3, H3K27me3, and H3K9me3 in histone extracts from cysts of three subsequent generations from both the treatment and control groups. The representative cropped blot shown here highlights the protein of interest (full length blots are included in the Figure S6). “+” represents higher protein expression level and “–” represents lower protein expression level relative to histone calf thymus (positive control), which was regarded as 1.0. Graphical representation and quantitative analysis of optical density of histone H3K4me3, H3K27me3, and H3K4me3 levels in brine shrimp were performed by Image software. Error bars represent the standard deviation (n = 3). Significant differences (P < 0.05) as compared to the positive control (P < 0.05) (*) are indicated with an asterisk (*).

