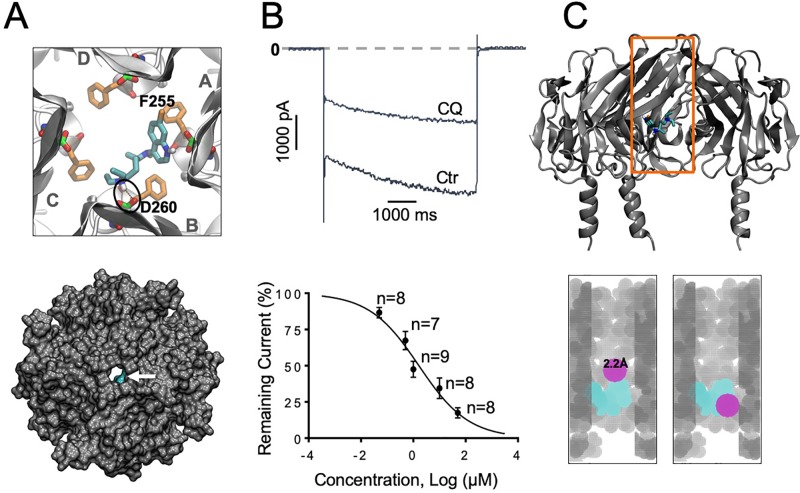
Figure 2.
IKACh block with chloroquine. (A) Docking of chloroquine in the intracellular domain of Kir3.1. The lowest energy pose is shown. The D260 and F255 residues from each of the four Kir3.1 subunits are shown in green and orange sticks respectively. The tertiary amine nitrogen of chloroquine (cyan sticks) forms a hydrogen bond (black circle) with the side chain of D260 in the B subunit, while the aminoquinoline ring of chloroquine is in close proximity to the phenylalanine ring of F255 in the A subunit. Van der Waals representations of the channel bound to the drugs (cyan) viewed from the extracellular side is shown in the bottom panel. (B) Barium sensitive IKACh traces in response to −140mV step pulses from a holding potential of −20 mV in the presence of 1 μM chloroquine (CQ). (B) Concentration–response curves. IC50 for chloroquine block of IKACh: 1.2 μM, Hill Slope = −0.48, R2=0.74. (C) Top panel: Longitudinal view of chloroquine bound to Kir3.1. Orange box denotes the voxelated part of the channel shown below. Bottom panel: Voxelation of Kir3.1 ion permeation pathway (grey) in complex with chloroquine (cyan). A probe (magenta) of radius 2.2 Å or larger, is blocked by chloroquine.

