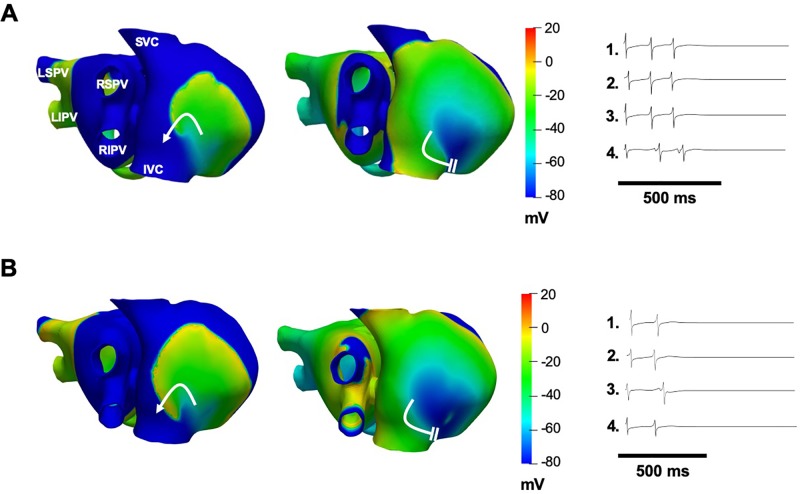
Figure 6.
Simulations of 1 μM chloroquine terminating AF by dual block of IK1 and IKACh by 50% (A), or by block of IKr by 30% and block of IK1 and IKACh by 50% (B). Voltage maps are snapshots of the last rotation of the re-entrant wave, where AF terminates after the wavefront interacts with the wavetail (white parallel lines). Curved white arrows: rotation direction. EGMs show arrhythmia termination.

