Figure 2.
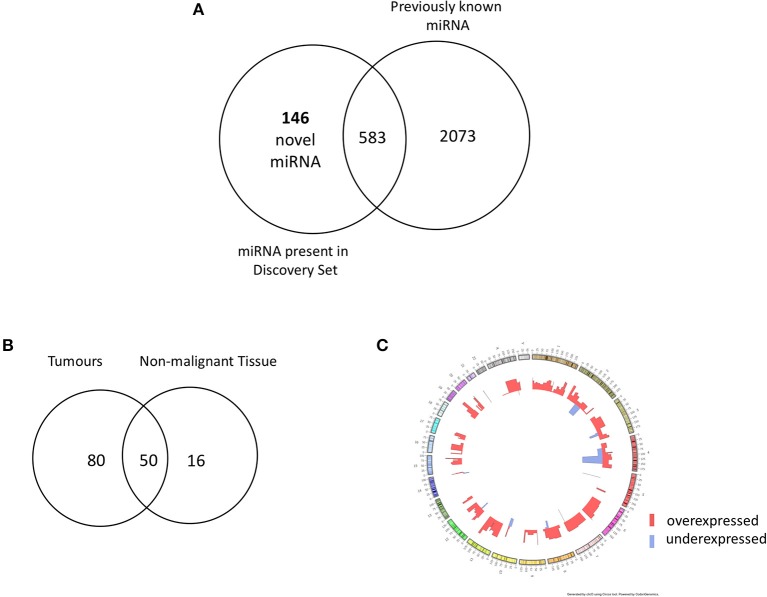
(A) Venn diagram summarizing the relative proportion of novel vs. previously identified miRNAs expressed to the same levels in the TCGA cohort compared to the current annotation of miRNA repositories. An addition of 146 novel miRNAs to 583 previously annotated sequences expressed to the same d level in the TCGA increases the transcriptome head and neck tissues substantially. (B) Venn diagram of novel miRNAs identified in head and neck squamous cell carcinoma tumor tissue (n = 523) and non-malignant (n = 43) tissue. Our results revealed 146 novel miRNA candidates; 80 and 16 were observed exclusively in non- malignant and tumor tissues, respectively, with 50 miRNA candidates detected in both groups. (C) Circos plot displaying the genomic localization of the novel miRNAs. The outermost circle displays the human autosomal chromosomes, and the inner layers show the expression fold changes (logged) of the novel miRNAs in head and neck squamous cell carcinoma tumors in relation to matched non-malignant tissue [created by ClicO FS: An interactive web-based service of Circos (42)].

