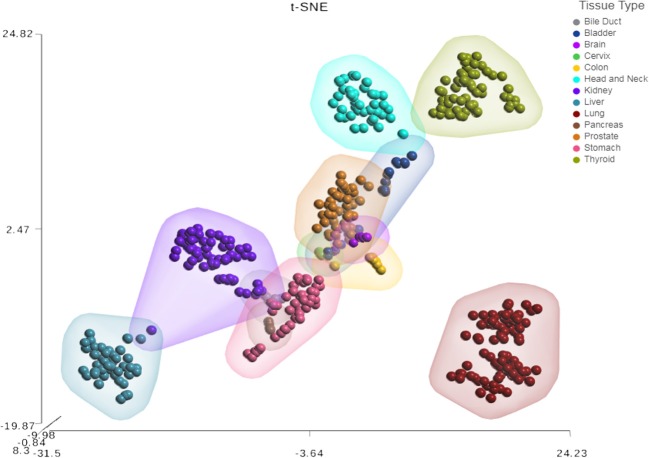
Figure 3.
Tissue-specific expression patterns of unannotated miRNA transcripts. t-Distributed Stochastic Neighbor Embedding (t-SNE) analysis T-SNE shows tissue specificity of head and neck non-malignant tissue compared to other non-malignant tissue from The Cancer Genome Atlas (TCGA); bile duct (n = 9), bladder (n = 19), brain (n = 5), cervix (n = 3), colon (n = 9), were compared to head & neck (n = 43), kidney (n = 71), liver (n = 47), lung (n = 91), pancreas (n = 4), prostate (n = 52), stomach (n = 45), and thyroid (n = 59).

