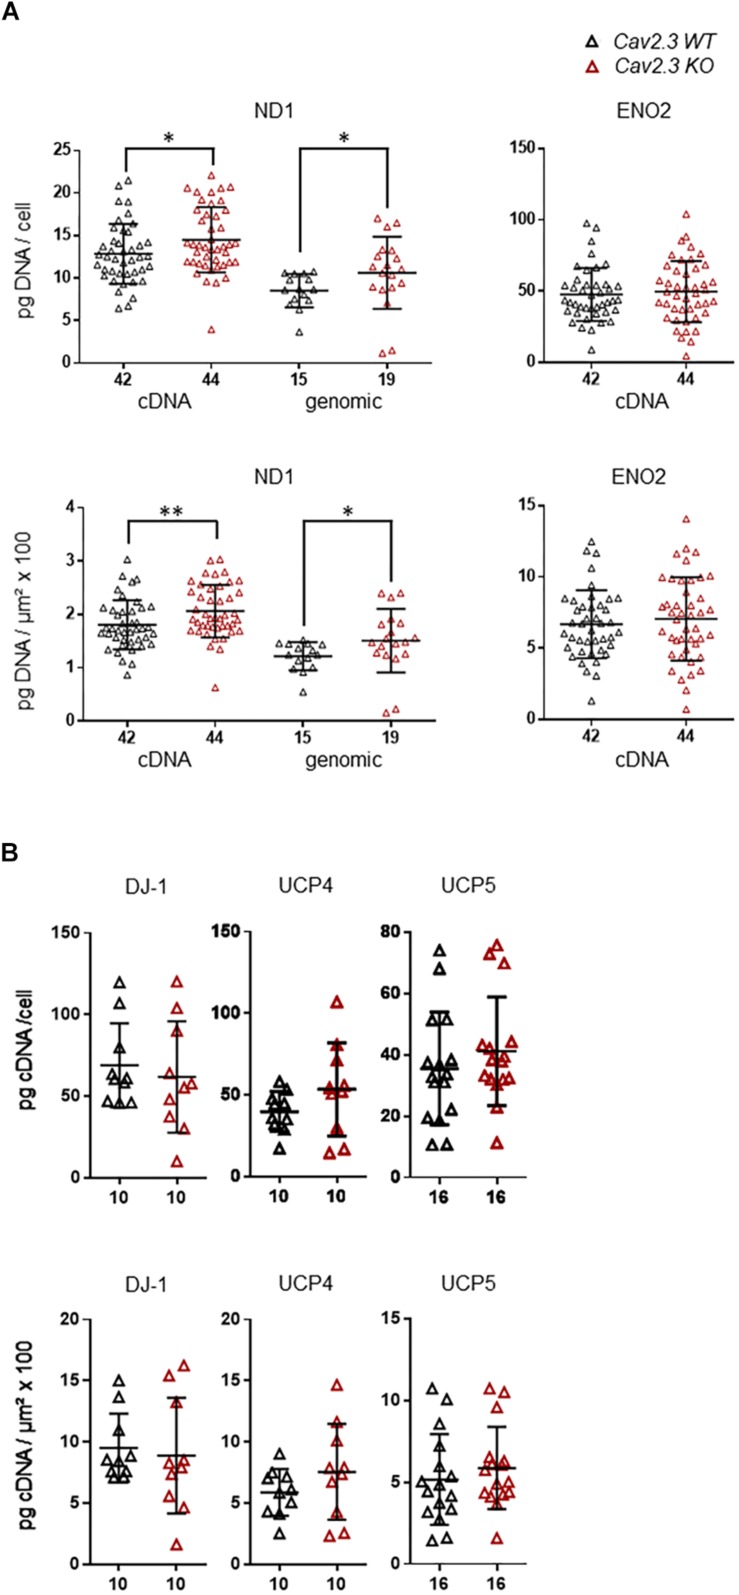
FIGURE 4.
Higher expression levels selectively of ND1 cDNA and genomic DNA in SN DA neurons from Cav2.3 KO mice compared to WT. (A) Left: qPCR-derived relative cDNA and genomic DNA levels of mitochondrially coded NADH-ubiquinone oxidoreductase chain 1 (ND1) in individual TH positive SN DA neurons from adult Cav2.3 WT and KO mice, relative to respective tissue cDNA derived standard curves (in pg/cell, upper), or normalized to specific laser-microdissected neuron sizes (in μm2 × 100, lower). Note that ND1 cDNA levels reflect cDNA + genomic DNA-derived signals, as the ND1 gene contains no intron, and cDNA as well as genomic ND1 levels are elevated in the KO. Right: Similar qPCR-derived relative cDNA levels for the same samples as in (A, left) for the neuron-specific enolase (ENO2). (B) Relative RT-qPCR-derived data from individual TH positive SN neurons from Cav2.3 KO and WT mice for the genes as indicated (displaying lower mRNA levels in SN DA neurons from NCS-1 KO mice). All data are given as scatter plots with mean ± SD. Significant differences are indicated according to Mann–Whitney U-tests and marked with asterisks (∗p ≤ 0.05; ∗∗p < 0.01). Numbers of analyzed individual SN DA neuron-derived cDNA samples (n) are given on the x-axis. All data and statistics detailed in Supplementary Figure S2 and Supplementary Tables S2, S4.

