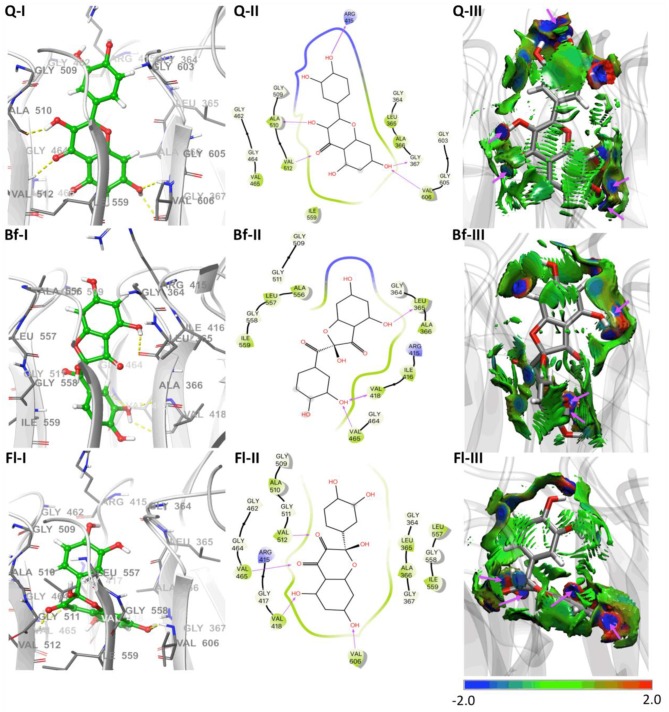
Figure 4.
Molecular docking results of Q and Qox on Keap1. (I) Representative amino acid residues surrounding Q or Qox in the binding pocket of Keap1. (II) Two-dimensional interaction map of Q or Qox and human Keap1. The arrows indicate potential interactions between amino acid residues and Q or Qox. (III) NCIPLOT isosurface gradient (0.6 au) of Q or Qox on the structure of Keap1. The surfaces are colored on a blue-green-red scale according to the strength and type of interaction. Blue indicates strong attractive interactions, green indicates weak van der Waals interactions, and red indicates a strong nonbonded overlap.

