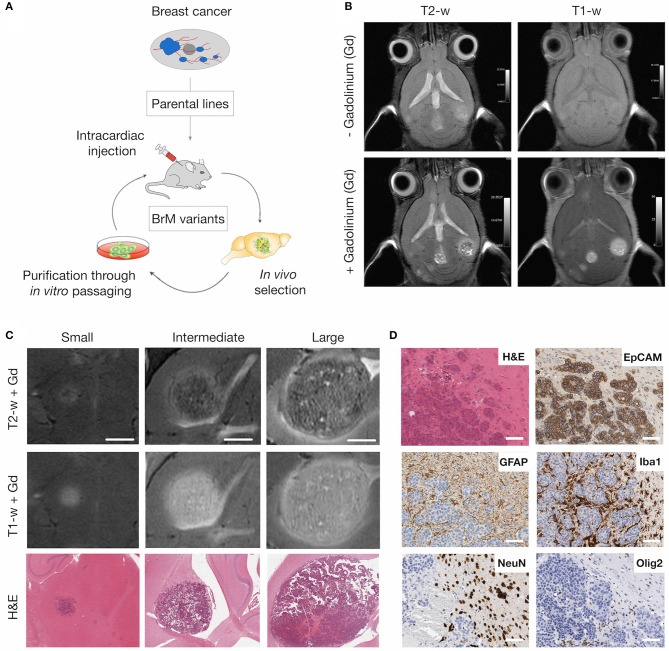
Figure 1.
MRI of brain metastatic lesions in the 99LN-BrM model. (A) Schematic depicting the selection of brain metastatic variants derived from parental cell lines through multiple rounds of in vivo selection following intra-cardiac injection. (B) Representative MR images of T1- and T2-weighted sequences with and without contrast enhancement. (C) Representative MR images and H&E stained sections for different stages of tumor progression (small, intermediate, and large BrM). Scale bar indicates 1.5 mm. (D) Representative images of brain metastasis-associated stromal reactions. Tumor cells stained for the epithelial cell marker EpCAM, astrocytes, macrophages/microglia, neurons and oligodendrocytes are detected by GFAP, Iba1, NeuN, and Olig2 expression, respectively. Scale bars indicate 100 μm.

